• Home
  • Forums
  • Trades
  • News
  • Calendar
  • Market
  • Brokers
  • Login
  • Join
  • User/Email: Password:
  • 11:46pm
Menu
  • Forums
  • Trades
  • News
  • Calendar
  • Market
  • Brokers
  • Login
  • Join
  • 11:46pm
Sister Sites
  • Metals Mine
  • Energy EXCH
  • Crypto Craft

Options

Bookmark Thread

First Page First Unread Last Page Last Post

Print Thread

Similar Threads

Trading correlation pairs by using the other pairs 736 replies

Looking for Death Cross and Golden Cross indicators 4 replies

Rsi cross indicator? (NOT cross 50, etc) 44 replies

Does trading the Cross pairs makes any sense at all? 6 replies

Royal Cross/Fresh Cross 7 replies

  • Trading Discussion
  • /
  • Reply to Thread
  • Subscribe
  • 17
Attachments: Trading cross pairs
Exit Attachments

Trading cross pairs

  • Post #1
  • Quote
  • First Post: May 16, 2022 8:50am May 16, 2022 8:50am
  •  alps99
  • | Joined Jun 2018 | Status: Member | 67 Posts
Once i read this trick from an ex senior bank trader on twitter, the real one. I took note but quickly forgot about it.
I accidentally find it to day.

So let explained the idea it by a story. You can skip this and scroll to below part.

Quote
Disliked
"Suppose the town has 2 mobilephone store: Store A & Store B. They sell exact the same kind, same quality, identical in everything & from the same importer.
Quote
Disliked
Store A often sells it with their premium insurance plan (let's call it phone A), so normally phone A is 5% more expensive than phone from store B (let's call it phone B).
as exchange rate of phone A/phone B = 1.05
Normally!

Because it isn't 1.05 in some occasions. Say the guy just win a lottery and he want to buy 500 smartphone to give away to everyone in town. This large amount of buy (market) order injects to the market.
The supply side, on the other hand, only 2 store.
The guy is a gentleman, so he choose "with premium insurance" phone as a gift. He goes to store A and buy 50% of their stock.
Suddenly A fear that they'll run out of stock. They have to increase price a little (because they also want to satisfy other customers).
The exchange rate A/B now (temporaryly) is 1.10

And the guy has to step into store B and buy the rest, because 1.10 is too expensive to him, comparatively.
Store B, after watching this overnight millionaire about to buy everything, they also increase price.
Eventually both phone A & B rise in price.
The exchange rate A/B falls back to 1.05
He turn back to store A and keeps buying because his demand still not fully satisfied."


The rise & fall in exchange rate doesn't reflex the change in fundamental quality of phone A & B. It should be 1.05 as before.
But the sudden, large market order injected into market make this exchange rate temporary.

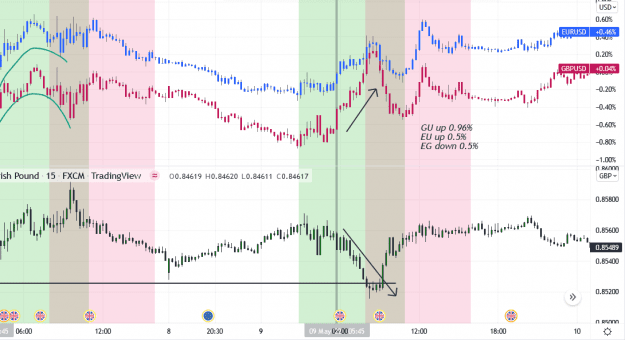
Take EURUSD, GBPUSD & EURGBP as an example.
Attached Image (click to enlarge)
Click to Enlarge

Name: screenshot.png
Size: 4 KB
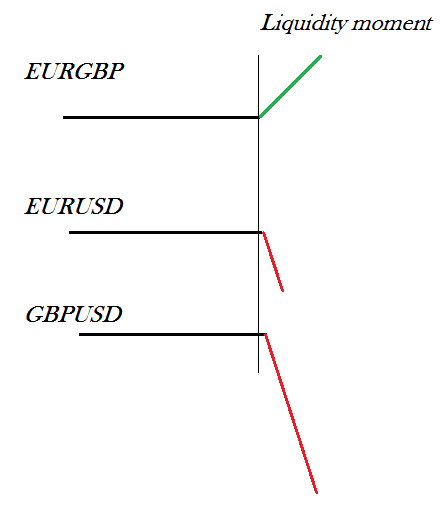
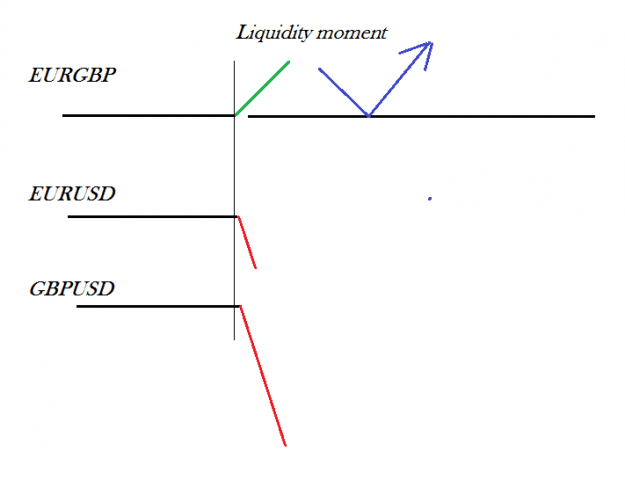
I call the moment when large market order injected to the market which causes big movement as "Liquidity moment". As we all know the reason for market to move is "Lack of liquidity". That is, if you want to buy a real estate and nobody sell at this price - lack of liquidity at this price - then you have to buy at that much higher price.

So we have large USD sell market order suddenly injected to the market, cause a sudden change in EURGBP rate.
Fundamentally, there is (almost) nothing change before & after that moment.

Example in real chart
I use NY (GMT-4) chart. This is M15 chart.
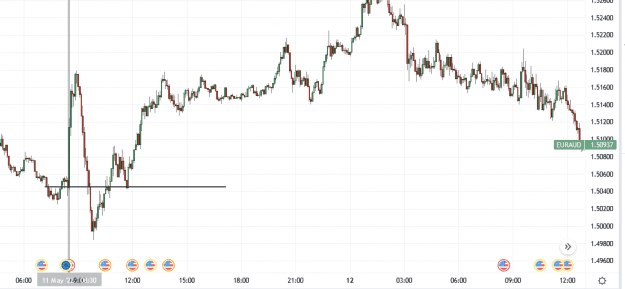
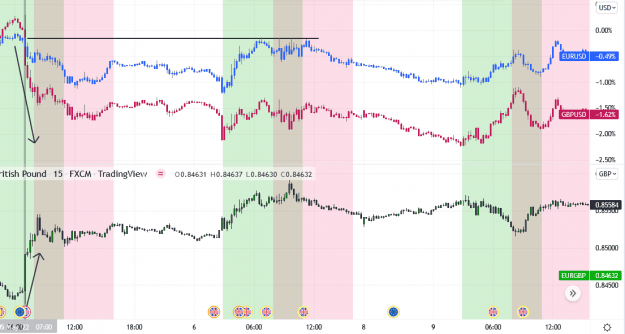
It's May 12, M15 candle at 8:37 am NY time. Btw this is the intersection of London & NY sessions.
Attached Image (click to enlarge)
Click to Enlarge

Name: screenshot.png
Size: 18 KB
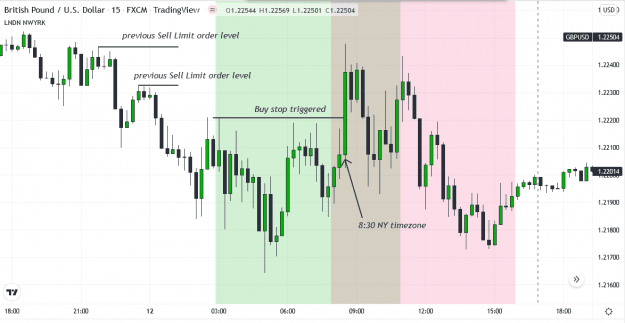
You can see this large bullish candle cut through bunch of equal highs above. So we can guess that bunch of buy stop will be triggered, adding fuel to the fire and push price up even more to these level above it.
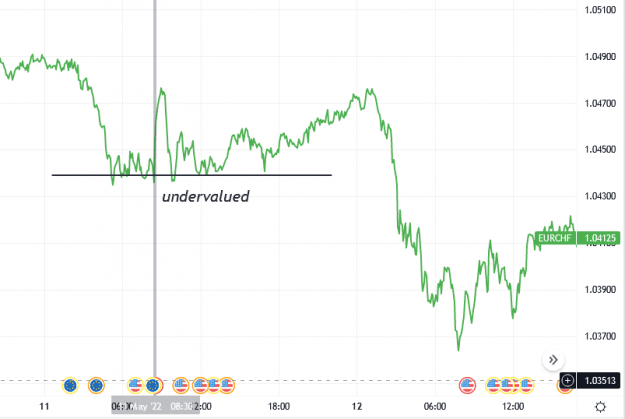
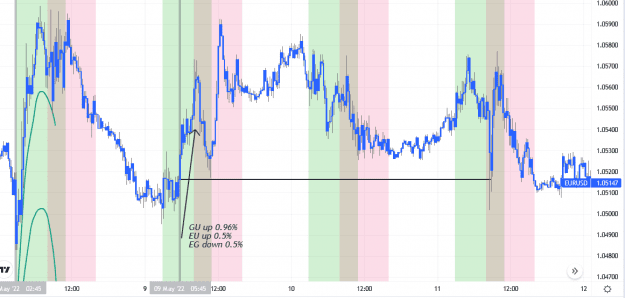
We have the same price action on EURUSD
Attached Image (click to enlarge)
Click to Enlarge

Name: screenshot.png
Size: 16 KB
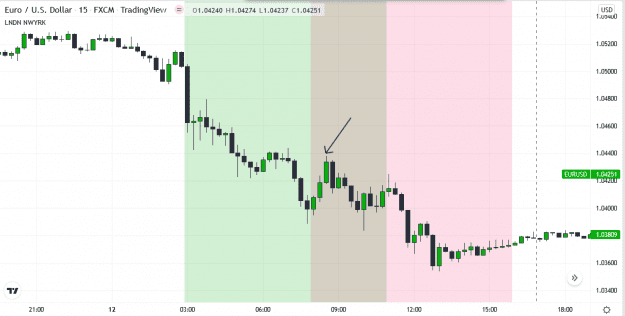
Large Dollar sell order injected into market, pushing both GBP & EUR up.
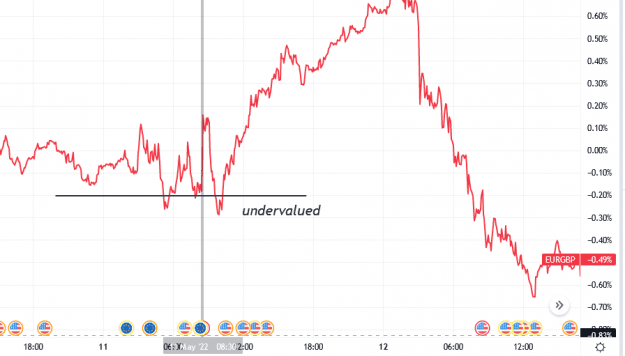
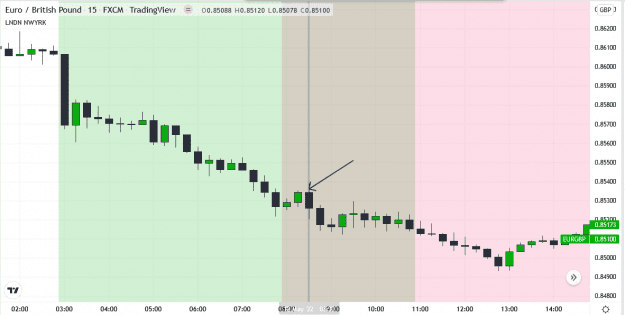
And the Side effect: EURGBP down.
Attached Image (click to enlarge)
Click to Enlarge

Name: screenshot.png
Size: 17 KB

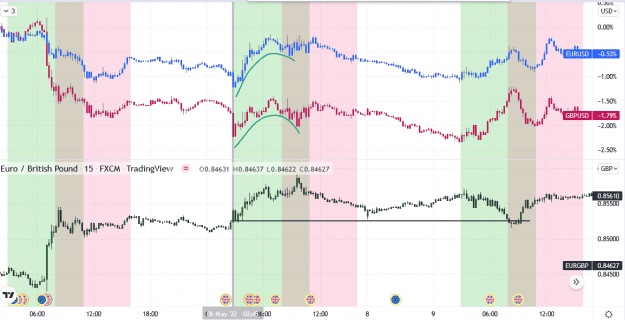
i zoom into 1 minute chart here:
Attached Image (click to enlarge)
Click to Enlarge

Name: screenshot.png
Size: 17 KB
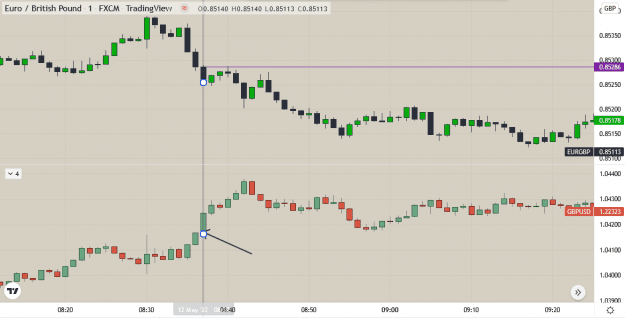
you can see the M1 candle, in GBPUSD chart it break out to upside and triggered Buy stop.
The Side effect is EURGBP down.

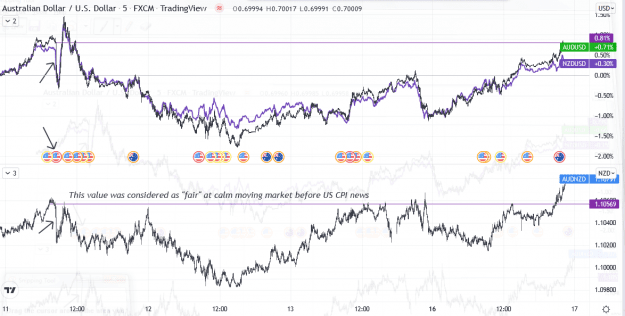
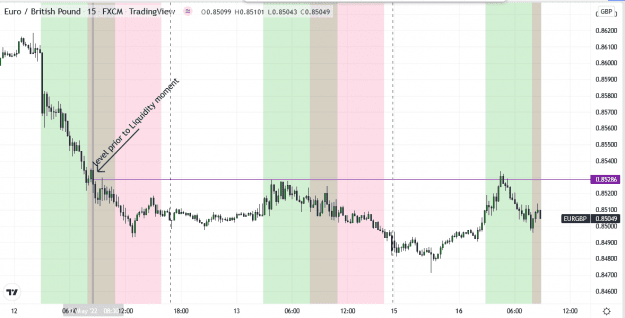
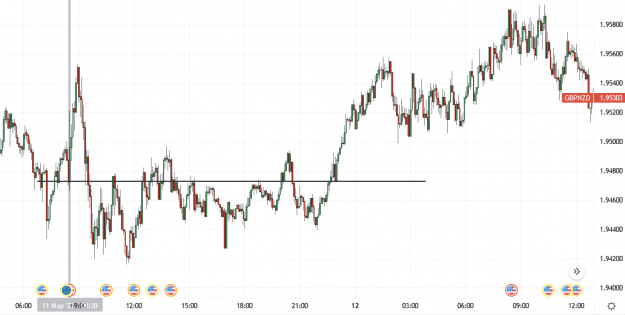
The trick is we consider the opening price as relative fair value, as price level prior to Liquidity moment.
EURGBP down, and also many wave of intraday speculation follow. We have an intraday downtrend on this pair.
But remember, the key level still above that opening price, prior to Liquidity moment.
I marked it at 0.8528 level.
This level is respected the very next day on May 13. Price touched it slightly and dropped immediately like a stone.
Attached Image (click to enlarge)
Click to Enlarge

Name: screenshot.png
Size: 5 KB
Attached Image (click to enlarge)
Click to Enlarge

Name: screenshot.png
Size: 22 KB
  • Post #2
  • Quote
  • May 16, 2022 2:41pm May 16, 2022 2:41pm
  •  tetis
  • Joined Sep 2007 | Status: LION HEART | 846 Posts
thank you and please give more examples
 
 
  • Post #3
  • Quote
  • May 16, 2022 11:21pm May 16, 2022 11:21pm
  •  alps99
  • | Joined Jun 2018 | Status: Member | 67 Posts
Quoting tetis
Disliked
thank you and please give more examples
Ignored
the technique detail is me extrapolate from my understanding of the concepts. As in my note about his idea as i remember: "Your business, i have nothing to do with it" then i need to find the way to apply the idea, by looking at market price action both backward and forward to gain experience.

Attached Image (click to enlarge)
Click to Enlarge

Name: screenshot.png
Size: 86 KB

Last Wednesday, May 11 the market seem to wait for US CPI release. It moved slowly toward 8:30 am NY time in narrow range with low volatility. Then the news hit, market exploded and chopped up & down.
There is very few fundamental reason for AUDNZD to move at that moment. To me the primary reason for AUDNZD to move at that moment is Liquidity.
Liquidity was different for AUD & NZD.

You can see that i cherry pick this pair. The other crosses at that moment aren't perpect as that.
They don't respect the previous "fair" level or don't react precisely at exact level.
The point is to expect the level will be respected in near future

If market priced in all information before news release (on cross pair), then news movement mess up with price, then anything that is deviated from the prior level should be considered (although temporarily) as over/undervalued, right?

EURGBP
Attached Image (click to enlarge)
Click to Enlarge

Name: screenshot.png
Size: 21 KB

EURCHF
Attached Image (click to enlarge)
Click to Enlarge

Name: screenshot.png
Size: 19 KB

EURAUD
Attached Image (click to enlarge)
Click to Enlarge

Name: screenshot.png
Size: 17 KB

GBPNZD
Attached Image (click to enlarge)
Click to Enlarge

Name: screenshot.png
Size: 17 KB
 
1
  • Post #4
  • Quote
  • May 16, 2022 11:28pm May 16, 2022 11:28pm
  •  alps99
  • | Joined Jun 2018 | Status: Member | 67 Posts
I measure candle's range to see if big Dollar's movement caused another big movement on cross pair, as evidence that cross pair move for the reason that is not related to fundamental factors.

Attached Image (click to enlarge)
Click to Enlarge

Name: screenshot.png
Size: 27 KB
 
1
  • Post #5
  • Quote
  • May 17, 2022 12:26am May 17, 2022 12:26am
  •  tetis
  • Joined Sep 2007 | Status: LION HEART | 846 Posts
Quoting alps99
Disliked
I measure candle's range to see if big Dollar's movement caused another big movement on cross pair, as evidence that cross pair move for the reason that is not related to fundamental factors. {image}
Ignored
Thank you for your response and hope for your success.
 
 
  • Post #6
  • Quote
  • May 17, 2022 12:50am May 17, 2022 12:50am
  •  alps99
  • | Joined Jun 2018 | Status: Member | 67 Posts
The reverse is also applicable.
This is basically the post news release technique.
If A/B movement was mainly driven by A, then B should have nothing to do with it (for the sake of simplicity, we assume that). Of course if economic condition in Europe is better, then one should expect London market would react joyfully. But for the sake of simplicity, we assume B is fairly independent in very short time period after the news.

To be clear if impact of news on A would have somethings to do with B, we can look at the similarity of their price action.
Here's some example:
BOE rate decision, May 5.
Attached Image (click to enlarge)
Click to Enlarge

Name: screenshot.png
Size: 25 KB
EUR/GBP shoot up, but mainly driven by GBP weakness (in red).
But interestingly, EURUSD (in blue) was dragged down.
The price level of EURUSD prior to BOE rate decision then became good resistance the day after.

May 6
Attached Image (click to enlarge)
Click to Enlarge

Name: screenshot.png
Size: 26 KB
The day after, the similarity between price action of EURUSD & GBPUSD. This wasn't GBP news. The news happened an hour prior to it, and it's moderate news. Both EURUSD & GBPUSD fallen quickly after broke down the previous day's low (=> lack of liquidity aka buy Limit order below caused quick moving market).
This price action caused side effect on EURGBP, this pair moved up.
But this opening level of the candle before "liquidity moment" (as mentioned in #1), became good support for price the next day

May 09
Attached Image (click to enlarge)
Click to Enlarge

Name: screenshot.png
Size: 25 KB
Just looking at price chart is hard to consider what moved what. But look at these number: % change of EURGBP roughly equal the difference between % increase of GBPUSD - EURUSD.
If EURGBP down as a side effect of Dollar trade, then its % change should be less than % change of both EURUSD & GBPUSD, wouldn't it? Otherwise, there would be big arbitrage opportunity and market participants would quickly cover it.
Moreover, this happen at London open time window, so GBP was primary reason.
So in this case we conclude that EURUSD is the independence actor here.
And this level become important support for next few days on EURUSD
Attached Image (click to enlarge)
Click to Enlarge

Name: screenshot.png
Size: 20 KB
 
1
  • Post #7
  • Quote
  • Last Post: May 17, 2022 1:43am May 17, 2022 1:43am
  •  vijiragavan
  • Joined Aug 2016 | Status: Member | 190 Posts
nice thread.. i had used eurgbp and gbpusd inverse correlation successfully.. been using currency strength indicator
Still learning. Telegram @jtprabu
 
 
  • Trading Discussion
  • /
  • Trading cross pairs
  • Reply to Thread
0 traders viewing now
Top of Page
  • Facebook
  • Twitter
About FF
  • Mission
  • Products
  • User Guide
  • Media Kit
  • Blog
  • Contact
FF Products
  • Forums
  • Trades
  • Calendar
  • News
  • Market
  • Brokers
  • Trade Explorer
FF Website
  • Homepage
  • Search
  • Members
  • Report a Bug
Follow FF
  • Facebook
  • Twitter

FF Sister Sites:

  • Metals Mine
  • Energy EXCH
  • Crypto Craft

Forex Factory® is a brand of Fair Economy, Inc.

Terms of Service / ©2022