Disliked{quote} The intention part is not visible on the candle itself until you zoom in to the LTF. What is obvious on it is the power of 3. Ask yourself how many times in the past (mostly when you were not informed as you are today) you entered a trade too early and it comes back for your stop loss and then after it carries on to the direction you believed or thought it would go. You might find that you have seen their intention but you might have not been aware or you didn't know that the manipulation is to follow. In a bar/candle you will not see the...Ignored
The intention can often be seen within the candle if you trade US pairs, it doesn't have to be hidden.
A candle on a chart is seen as a long thin rectangle, it's a mystery box hiding its intention not at the open of the candle but its purpose at its end of the candle.
The question unknown is what happened prior to the close of the candle
I want to know if the liquidity within the candle was being consumed in vast quantities.
I want to know if the liquidity within the candle was unbalanced excessively in either bids or asks.
In almost every major reversal (no thats bulls, every single one), there is an major imbalance event occurring with a single one minute candle at its climax.
It is normally followed by a "thrust away" candle back the other way a short time later.
There is no hidden agenda or intention if we can look inside the box and view the big players roadmap as they have just raised the flag and now pointing to a new hill over the horizon.
Tick volume in my mind is an fraudulent act by all brokers, too disguise the actual liquidity on any chart at any time is actually as shallow as a toddles pool, not deep like the Mariana trench.
So two questions
1.. Can any one spot the thrush up candle after the climax?.
2.. If the liquidity is so deep as some think, why is the order book effectively zero on one side - at the bottom?
Attached Image (click to enlarge)
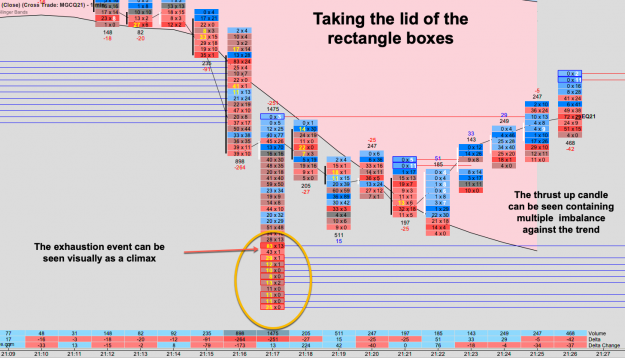
Trading thin liquidity at the boundary of the charts
13