• Home
  • Forums
  • Trades
  • News
  • Calendar
  • Market
  • Brokers
  • Login
  • Join
  • User/Email: Password:
  • 3:29am
Menu
  • Forums
  • Trades
  • News
  • Calendar
  • Market
  • Brokers
  • Login
  • Join
  • 3:29am
Sister Sites
  • Metals Mine
  • Energy EXCH
  • Crypto Craft

Options

Bookmark Thread

First Page First Unread Last Page Last Post

Print Thread

Similar Threads

Price Action and Trading Discussion 5,928 replies

Price action at the core / tma intra day 5,016 replies

Price Action discussion 26 replies

Family Guy 25 replies

  • Trading Discussion
  • /
  • Reply to Thread
  • Subscribe
  • 929
Attachments: Price action at the core = family members' discussion project
Exit Attachments
Tags: Price action at the core = family members' discussion project
Cancel

Price action at the core = family members' discussion project

  • Last Post
  •  
  • 1 106107108109Page 110 111
  • 1 Page 110 111
  •  
  • Post #2,181
  • Quote
  • Mar 3, 2022 10:51pm Mar 3, 2022 10:51pm
  •  TimeTells
  • Joined Dec 2018 | Status: Trading, and Music; that'll do lol | 2,400 Posts
Quoting venkatredy
Disliked
{quote}
( Target)
Ignored

Hi V,

Cheers pal, thanks for that.

I offer one more post about all the above to you WHILE using the Training Simulator.


On the 1 hour chart (training simulator) you will see one long candle.
(but on the candle close, do we know yet that the sell off/buy has “ended”, who knows !)

So start again, using the same DAY & period on the training simulator, yet choose the 15m timeframe THIS TIME, not the one hour,
and run the same process AGAIN observing this time if you can ‘see anything extra’ watching 15 min candles.

Then use the same DAY & period AGAIN on the training simulator yet choose the 1min timeframe THIS TIME, not the 1hr or 15m,
and run the SAME process observing this time if you can ‘see anything extra’ watching 1min candles.

(yes look at the SAME thing three times, on the 1hr, 15m & 1m)


On the 1min look now especially for “behaviour” when the “edge ending turns”, as it then might halt & reverse, maybe a couple of times,
or maybe run to a lower low/higher hi,
WATCH all these things, and look for ANYTHING different that happens WHEN the final edge ending has occurred and price starts reversing ‘seriously” this time.

What appears different at that point? When the reversal IS genuine, what happened then.


You could then go and find another large candle drop/rise, at another day or time, and do the same again.
With three timeframes also. And see if you find some (even tiny) similarity.
Then do that yet AGAIN at another candle drop/rise situation. And another.

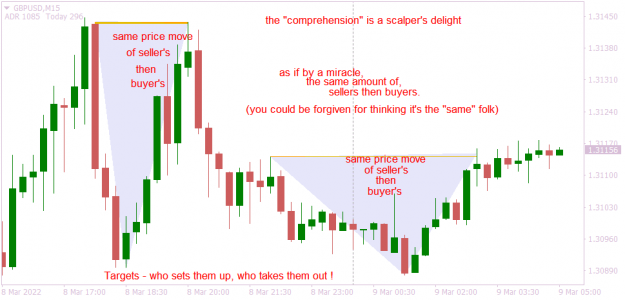
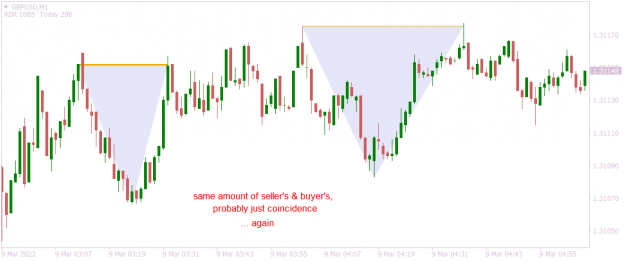
You are looking now for similarities as confirmations.
These similarities are not pip based, or candle shape based, they are "behaviour" based.
On your larger timeframe you “may” find confluence with other things on your standard template. Things that REPEAT. (and they WILL).
All this I suggest is just a simple “learning process” that a person would do in “any” new task they had.

Then, these are just the beginnings for a discretionary trader of course. But we had to start somewhere .
all the best
Pete
 
5
  • Post #2,182
  • Quote
  • Mar 8, 2022 1:31pm Mar 8, 2022 1:31pm
  •  Ieis5
  • | Joined May 2021 | Status: Member | 97 Posts | Online Now
so what is the summary of the method ?
 
 
  • Post #2,183
  • Quote
  • Mar 8, 2022 5:12pm Mar 8, 2022 5:12pm
  •  Pumi
  • Joined Nov 2017 | Status: Member | 490 Posts
Quoting Ieis5
Disliked
so what is the summary of the method ?
Ignored
There is no shortcut.
 
1
  • Post #2,184
  • Quote
  • Mar 8, 2022 9:43pm Mar 8, 2022 9:43pm
  •  aud
  • | Joined Apr 2008 | Status: Member | 950 Posts
Quoting bluesteele
Disliked
{quote} Is their a way to figure out the day’s high ? Good question...Yes you can with 99.99% certainty and here's how. There are 78-5M bars in a trading session i.e. The US30 SP500 etc... from the morning open at 630 EST till the close. Over 30 years of data tells us that : 5 minute bars Bar 1 : 20% probability of being the HI/LOW of the day. Bar 7 : 50% probability of being the HI/LOW of the day. Bar 13 : 70% probability of being the HI/LOW of the day. Bar 18 : 90% probability of being the HI/LOW of the day. Bar 78 : 99% probability of...
Ignored
So an hour and a half after the open there is a 90% chance either the high or low of the day will have been set.

Is that session specific, ie the NY session, or is data taken from the 3 sessions?
Good Trading
 
 
  • Post #2,185
  • Quote
  • Mar 8, 2022 9:57pm Mar 8, 2022 9:57pm
  •  bluesteele
  • Joined Aug 2007 | Status: Member | 1,608 Posts
Quoting aud
Disliked
{quote} So an hour and a half after the open there is a 90% chance either the high or low of the day will have been set. Is that session specific, ie the NY session, or is data taken from the 3 sessions?
Ignored
Hi Aud...
This is specific to the NY session..but I wouldn't be surprised if it is similar for London although I have not looked at FTSE data.

Cheers
Blue
The Best Loser Wins
 
1
  • Post #2,186
  • Quote
  • Mar 8, 2022 10:17pm Mar 8, 2022 10:17pm
  •  TimeTells
  • Joined Dec 2018 | Status: Trading, and Music; that'll do lol | 2,400 Posts
Quoting mixedbags
Disliked
{image}
Trade the lines - George, CrucialPoint, Billytt
"The comprehension is a scalper's delight" - Timetells
Ignored

Hahaa, hi Mb, cheers missed that one

I hope V & LT were taking note too.


A quick review follow up from this posted chart ... from just five days ago.


Quoting TimeTells
Disliked
{quote}
{image}
Ignored

(V & LT - an example of market timeframe fractality - a 15m chart, then on the 1min chart)


.
Attached Image(s) (click to enlarge)
Click to Enlarge

Name: GBPUSDM15 sellers and buyers.png
Size: 37 KB
Click to Enlarge

Name: GBPUSDM1 coincidence.png
Size: 31 KB
 
4
  • Post #2,187
  • Quote
  • Mar 9, 2022 12:14am Mar 9, 2022 12:14am
  •  venkatredy
  • | Joined Sep 2015 | Status: Member | 108 Posts
Quoting TimeTells
Disliked
{quote} Hahaa, hi Mb, cheers missed that one I hope V & LT were taking note too. A quick review follow up from this posted chart ... from just five days ago. {quote} (V & LT - an example of market timeframe fractality - a 15m chart, then on the 1min chart) . {image} {image}
Ignored
hi mike
taking note and trying to understand in depth
 
 
  • Post #2,188
  • Quote
  • Mar 9, 2022 12:30am Mar 9, 2022 12:30am
  •  TimeTells
  • Joined Dec 2018 | Status: Trading, and Music; that'll do lol | 2,400 Posts
Quoting venkatredy
Disliked
{quote}
trying to understand in depth
Ignored

Hi V, little bit by little bit. The shallow end of the swimming pool first, then the deeper parts.


The market ranges about 85% of the time (I read that somewhere it's NOT my data).

This ranging sees the "market behaviour" as is on my charts above (on all my charts in fact lol).


Start at the 1min and see what you can absorb
(no indicators, no data, just observation - while you can use data and/or indis later if you wish).

And it's fractal, the timeframes will all look pretty much the same.

The 1min gives you the behaviour for the upcoming move back to range
The 15m gives you some nice swing points to exit or enter
The 1hr shows you the "current" larger structure of where price has been this week

You can also look at the daily should you wish.
I know traders who can tell me the future based on the Weekly (pretty much most of the time, as I have observed, on up to 28 pairs).

BUT you have to find your own way. That's the hardest truth.

Else you will end up just "following" some random person who says to you "Do it MY way, it works for ME"
What if they win the lottery and you dont see them ever again. How can they help YOU then.

Learn it all by yourself and for yourself. And when you see "it" (AND 'get it'), you will never NOT see it again.

And then it's YOURS.

Just look to begin with.
You wont even know what you're looking for. At the beginning.
Many great discoveries in history were made by folk who were looking for something entirely different, at the time.

Tread carefully. And do not pay anyone any money to teach you. You will be proud when you find it and can do it by yourself.

all the best V
Pete
 
7
  • Post #2,189
  • Quote
  • Mar 9, 2022 2:21am Mar 9, 2022 2:21am
  •  Ieis5
  • | Joined May 2021 | Status: Member | 97 Posts | Online Now
Quoting Pumi
Disliked
{quote} There is no shortcut.
Ignored
what is the full systematized exposition then
 
 
  • Post #2,190
  • Quote
  • Mar 10, 2022 1:43pm Mar 10, 2022 1:43pm
  •  venkatredy
  • | Joined Sep 2015 | Status: Member | 108 Posts
Quoting TimeTells
Disliked
{quote} Hahaa, hi Mb, cheers missed that one I hope V & LT were taking note too. A quick review follow up from this posted chart ... from just five days ago. {quote} (V & LT - an example of market timeframe fractality - a 15m chart, then on the 1min chart) . {image} {image}
Ignored
pete can u please share some more example chart screen shot reg fractal nature
 
1
  • Post #2,191
  • Quote
  • Edited 7:37pm Mar 10, 2022 7:25pm | Edited 7:37pm
  •  TimeTells
  • Joined Dec 2018 | Status: Trading, and Music; that'll do lol | 2,400 Posts
Quoting venkatredy
Disliked
{quote}
pete can u please share some more example chart screen shot reg fractal nature
Ignored

Hi V,

Yes I gave a quick example of the fractal nature of forex charts in my chart pics on this post above,

Quoting TimeTells
Disliked
{quote}
an example of market timeframe fractality - a 15m chart, then on the 1 min chart
Ignored


But without any explanation, sorry, let me take it one step further.

You will see on those 2 chart pics, a 15m & a 1 min, that the nature of forex price behaviour (pics were the same day & just a few hours apart)
is roughly the same in that price chased to a price point, reached a price point, and then reversed back to the price points' origin.

As it "looks" roughly the same on both the 15m AND 1 min chart I like to refer to that as the 'fractal nature' of forex.
(If I had NOT shown the timeframe text ie 15m or 1min, or the pair name, OR the actual right side prices, then a trader might have difficulty telling them apart).


Fractality is a narrative to get me thinking about Forex.

It is NOT a method of trading.

I needed first to separate and CLARIFY my 'understanding' of the behaviour of forex price, from the WANT to just trade it now.

Which is why, I guess, some traders like to trade forex at the apex of a 1 min price move spike or exhaustion for immediate reversals and why other traders like to view a bigger picture such as a one hour chart or daily bar or a weekly chart for example.

There is no ONE way to trade forex which is why newcomers to forex are being done a disservice in some way (in my opinion) when successful forex traders come on our platform here and say "Do it MY way, it works for me".

Once a trader grasps the full complexity of forex behaviour from its outer workings back into its inside workings, then at THAT POINT a trader is far more well versed imho to then say "I wish to be a 1min scalper or a 1 week positional trader".

Else we are all just telling newcomers to forex that our way suits US best (but which may not suit the newcomer at all).

(For examaple I started trade training on the daily bar and fell asleep at the wheel waiting for a trade setup to occur - I was told it might take two days before a setup showed - didn't suit my trading style at all).


Here I go again, sorry ... back to the F R A C T A L nature of forex. I hope those 2 charts from the post above show what I mean.

All fractality in forex told me is that the forex market is quite well organised ()
Rather than just the good old two ticks up from some buyers and one tick down from a seller type of forex price occurance.


So, once more, the fractal nature of forex is NOT a method of forex trading
(its a method, if you can grasp it, of the comprehension of forex price behaviour, which actually HAS a repeateable behaviour).


And if you got to the end of my post (always long, apologies) then DO NOT THINK hey this is HOW we can trade forex.
This is just the BEGINNING of an understanding of the complexity AND simplicity of the forex market.

Trading involves much more. We haven;t even got anywhere near discussing account/money management, how to handle a trade which starts to run against you etc etc

And I WON'T be doing this myself , as there are others who have posted on here with far more skills than me on this, cheers Blue/Kev, as I am a forex gambler - lol well we ALL ARE in my eyes - while we then use probabilty as our trade determinator.

(I gamble/trade with full discretionary freedom using many things, as well as observational experience, that are at my disposal before pushing the buy/sell button).

And, V, I am NOT looking for a pattern. A pattern does NOT ever determine my trade entry.

(while a behaviour does determine to some extent my trade entry, but which is NOT a repeating pattern, and I had discussed all this somewhere on the CaptalTrader quant thread when he asked me the same question, but I can't find the post sorry)


Fractality
Here's a quick Tube on fractality, I only watched it up to the 4min mark so I can't comment on what the gal says after that
- here is her words

"No matter where I look or how much I zoom in, I will see the same pattern over and over.
Never ending patterns like this on any scale, on any level of zoom look roughly the same, are called fractals."


.
Inserted Video
 
3
  • Post #2,192
  • Quote
  • Edited Mar 11, 2022 6:18am Mar 10, 2022 8:55pm | Edited Mar 11, 2022 6:18am
  •  simnz
  • Joined Nov 2015 | Status: Member | 2,523 Posts
Quoting bluesteele
Disliked
{quote} Is their a way to figure out the day’s high ? Good question...Yes you can with 99.99% certainty and here's how. There are 78-5M bars in a trading session i.e. The US30 SP500 etc... from the morning open at 630 EST till the close. Over 30 years of data tells us that : 5 minute bars Bar 1 : 20% probability of being the HI/LOW of the day. Bar 7 : 50% probability of being the HI/LOW of the day. Bar 13 : 70% probability of being the HI/LOW of the day. Bar 18 : 90% probability of being the HI/LOW of the day. Bar 78 : 99% probability of...
Ignored
Excellent work . I help retirees to make passive income from day trading as part of a non-profit community project. It is quite tough making the risk averse investors understand if day trading can really generate income for them.

I don't know Excel or programming language but based on my 20 years self directed trading experienced, I requested an FF member Bluerain to make an indicator that captures raw data and displays 1440 1 minute data using various filters on the chart and produces Excel and text files .
My main intention was to explore probabilities of day trading by comparing the day trading with boiling milk and ending up with periodical pip averages as the condensed milk. And how by identifying sideways markets they can make quick money with the help of a fixed grid EA to execute transactions and follow a system with daily income targets. Except to look at charts and note down known price price triggers events calendar and identify consolidation or sideways patterns with patience . Selective hours of trading.

Surprisingly, most of them are making money by sticking to targets strictly while I keep breaking the system and not getting the desired results.
Strangely, risk-averse traders are doing well. The focus is on buying the dips and selling the rallies in 50 pip range after breakouts have happened.
I am sharing the spreadsheet report in text format that has been generated by the indicator.

If you are willing to modify the spreadsheet to add the counting filters mentioned by you as another means of exploring probabilities, I will be happy to share the mql of the indicator with you.

Thank you.
Attached Image (click to enlarge)
Click to Enlarge

Name: Exploring probabilities.jpg
Size: 478 KB
Practice makes a person perfect
 
 
  • Post #2,193
  • Quote
  • Edited 6:36pm Mar 12, 2022 5:04am | Edited 6:36pm
  •  lasttry
  • | Additional Username | Joined Nov 2021 | 83 Posts
Quoting TimeTells
Disliked
{quote} Hi V, Cheers pal, thanks for that. I offer one more post about all the above to you WHILE using the Training Simulator ...
Ignored
Hi Pete,
could you please give me a clue on this simulator ? as i download & unzip it, i got 2 files :

*) Training2. mq4
*) Training2.zip

and as i try to unzip the Training2.zip file, it is a corrupt file ....
i don't think that Training2.mq4 is an expert file. but i tried to put it to Experts folder (just to make sure), try to run it ... and yes, it is not an expert mt4 file. then I tried to put this file to Indicators folder, it did not run, and no error message (just loaded & then removed can be seen at Experts tab, at bottom of the mt4 platform) ... why ??? is it something wrong with my unzip software, or it is really a corrupt zip file ??

Where can i get the real expert files ? Could you please send it (unzip one) here /other place ?
Thank you in advance.
 
 
  • Post #2,194
  • Quote
  • Edited 7:17pm Mar 12, 2022 7:01pm | Edited 7:17pm
  •  TimeTells
  • Joined Dec 2018 | Status: Trading, and Music; that'll do lol | 2,400 Posts
Quoting TimeTells
Disliked
Install it in your Experts folder if you wish.
After install and restart open an MT4 chart and
use Ctrl-T and Ctrl-R to show the simulator screen.
“Select the Training2 downloaded expert advisor from the list of drop downs”
“Choose a symbol of your favourite PAIR”
“Choose the slowest model operation EVERY TICK to begin with”
“In the Use Date choose any time from the past (eg 3 months ago)”
“Tick Visual Mode but do NOT tick Optimization”
Ignored


Quoting lasttry
Disliked
{quote}
Hi Pete, could you please give me a clue on this simulator ? as i download & unzip it, i got 2 files : *) Training2. mq4 *) Training2.zip and as i try to unzip the Training2.zip file, it is a corrupt file .... i don't think that Training2.mq4 is an expert file. but i tried to put it to Experts folder (just to make sure), try to run it ... and yes, it is not an expert mt4 file. then I tried to put this file to Indicators folder, it did not run, and no error message (just loaded & then removed can be seen at Experts tab, at bottom of the mt4 platform) ... why ??? is it something wrong with my unzip software, or it is really a corrupt zip file ?? Where can i get the real expert files ? Could you please send it (unzip one) here /other place ? Thank you in advance.
Ignored


Hi LT,

Mate download the ... training2.mq4

Install the training2.mq4 in your EXPERTS FOLDER.

Restart your MT4

Do Ctrl-T and Ctrl-R which gives you the Simulator start screen and click the down arrow at the far right to show the list of experts you can choose from

It will now show training2.exe
Choose that as your expert

Choose a symbol (pair), model (every tick), click 'use date' and choose any start date from the past and a finish date
tick "Visual Mode" but NOT 'optimization'
(the 'slider' on the visual mode can also be adjusted for the speed of the candles later as you are watching)

(I myself would start with period = 1hr, then later do it with period = 15m, same dates,
and much later at the end of your visual studies, and to finesse your price activity understanding at the 'turn points', go down to the 1 min)

Then click START (bottom right)

(I load a "clean" template ie no indis, nothing - however later you can add your own template,
but at the start just watch candle progression and see if you can pick price direction going UP or DOWN as the day evolves
as a trader THAT is what you need to know, see, or understand "in the long run" ie to be trading ultimately WITH the direction of price, however,

if you load your own template to start you will only be watching your Template again (indis etc) and not price activity - which is what you are wanting to see -
else there are 10,000 threads on FF & therefore maybe 10,000 possible templates if you know what I mean -
templates come LAST imho, AFTER observational understanding )

all the best LT
Pete
 
1
  • Post #2,195
  • Quote
  • Mar 12, 2022 7:16pm Mar 12, 2022 7:16pm
  •  lasttry
  • | Additional Username | Joined Nov 2021 | 83 Posts
Quoting TimeTells
Disliked
{quote} {quote} Hi LT, Mate download the ... training2.mq4 Install the training2.mq4 in your EXPERTS FOLDER. Restart your MT4 Do Ctrl-T and Ctrl-R which gives you the Simulator start screen and click the down arrow at the far right to show the list of experts you can choose from It will now show training2.exe Choose that as your expert Choose a symbol (pair), model (every tick), click 'use date' and choose any start date from the past and a finish date tick "Visual Mode" but NOT 'optimization' (the 'slider' on the visual mode can also be adjusted...
Ignored
Thank you very much TT,
it works now ... great !! it was my bad, i forgot to do it at Strategy Tester with Visual Mode ... sorry
 
 
  • Post #2,196
  • Quote
  • Mar 12, 2022 7:18pm Mar 12, 2022 7:18pm
  •  TimeTells
  • Joined Dec 2018 | Status: Trading, and Music; that'll do lol | 2,400 Posts
Quoting lasttry
Disliked
{quote}
Thank you very much TT, it works now ... great !! it was my bad, i forgot to do it at Strategy Tester with Visual Mode ... sorry
Ignored

all the best pal
 
 
  • Post #2,197
  • Quote
  • Mar 12, 2022 7:39pm Mar 12, 2022 7:39pm
  •  TimeTells
  • Joined Dec 2018 | Status: Trading, and Music; that'll do lol | 2,400 Posts
Quoting lasttry
Disliked
{quote}
Thank you very much TT, it works now ... great !! it was my bad, i forgot to do it at Strategy Tester with Visual Mode ... sorry
Ignored

LT,
Oooops, one last thing !

After watching the simulator with a clean chart, and before using your (own) templates later.

Why don't you,

seeing this IS George's thread

Next after a "clean" chart, draw in George's Swing Targets (as explained on his first thread),

I have them on my charts just as second nature now so I sometimes forget to mention it

To start with, just draw in the two "George Targets",
the one target that is ABOVE where price is now,
and the other one that is BELOW where price is now.

(and add new ones once the old ones get taken out, so there are always two on your chart to begin with)

see what you reckon, then add your own templates and later try other templates, data etc etc etc,

all the while remembering that at the end of the day

it is YOU who will make you successful (not what you add on your screen as guides, or what others, including myself, might offer you with words along the way)


3
  • Post #2,198
  • Quote
  • Mar 26, 2022 3:33pm Mar 26, 2022 3:33pm
  •  ntk
  • Joined Dec 2018 | Status: Member | 1,132 Posts
Quoting TimeTells
Disliked
So a chart maybe (yep). Moodybot and I had a quick Skype chat the other day (infrequent) and the USDCAD pair came up in the discussion. And well done AGAIN Andy, as his UC pair went right to his TP line yesterday, at the end of Asia I see. Then after a pullback price went back up to a maths line target at the 19:00 candle chart time AND which was at another George’s Target (NOT so unexpected, lol). Any folks out there could now explode their own UC chart and look hard LEFT to see where George’s Target SAT at the 22:00 mini swing candle back on 6th...
Ignored
beautiul chart and lesson. thank you.
the answer is momentum up. we got the choCH, change of structure from down to up trend , so when the area is retested a buy should be successul
@TTT experiment
 
2
  • Post #2,199
  • Quote
  • Apr 27, 2022 10:23am Apr 27, 2022 10:23am
  •  lasttry
  • | Additional Username | Joined Nov 2021 | 83 Posts
It is too difficult to trade ... i just realized it... Eurusd is going crazy to the deep ocean without any reason ... Daily target is taken, still going down... all pieces of cake are eaten by bigboy, so no "Delicious" cake are left anymore... must give up now I think, before it becomes worse, and worse... Rally can not understand the market, even if we compare to index like the post here :
https://www.forexfactory.com/thread/...1#post13982791
Will it really go to 1.03.00 as he said ??? hmm, very dangerous ... ... like a film creator always said ::cut,cut,cut ... do it again from beginning... ?? but it is dark now, no light, no star, no moon, no sunshine .. maybe it is too late? no opportunity & strength anymore... ... what to do? i do not know... may be take a rest, just go to sleep? temporary or forever? do not know either ...
 
 
  • Post #2,200
  • Quote
  • Apr 27, 2022 8:23pm Apr 27, 2022 8:23pm
  •  PeterCaleb
  • Joined Nov 2020 | Status: Been And Gone. | 1,345 Posts
Quoting lasttry
Disliked
It is too difficult to trade ... i just realized it... Eurusd is going crazy to the deep ocean without any reason ... Daily target is taken, still going down... all pieces of cake are eaten by bigboy, so no "Delicious" cake are left anymore... must give up now I think, before it becomes worse, and worse... Rally can not understand the market, even if we compare to index like the post here : https://www.forexfactory.com/thread/...1#post13982791 Will it really go to 1.03.00 as he said ??? hmm, very dangerous ......
Ignored
I'd say you need to lay off the coffee and stop listening to no gooders on sites like these who clearly are more concerned with rhetorical trading and social media "stuff" instead of real life.


Peter
Trading's for those who learn independently. Everyone else is just blind.
 
 
  • Trading Discussion
  • /
  • Price action at the core = family members' discussion project
  • Reply to Thread
    • 1 106107108109Page 110 111
    • 1 Page 110 111
0 traders viewing now
  • More
Top of Page
  • Facebook
  • Twitter
About FF
  • Mission
  • Products
  • User Guide
  • Media Kit
  • Blog
  • Contact
FF Products
  • Forums
  • Trades
  • Calendar
  • News
  • Market
  • Brokers
  • Trade Explorer
FF Website
  • Homepage
  • Search
  • Members
  • Report a Bug
Follow FF
  • Facebook
  • Twitter

FF Sister Sites:

  • Metals Mine
  • Energy EXCH
  • Crypto Craft

Forex Factory® is a brand of Fair Economy, Inc.

Terms of Service / ©2023