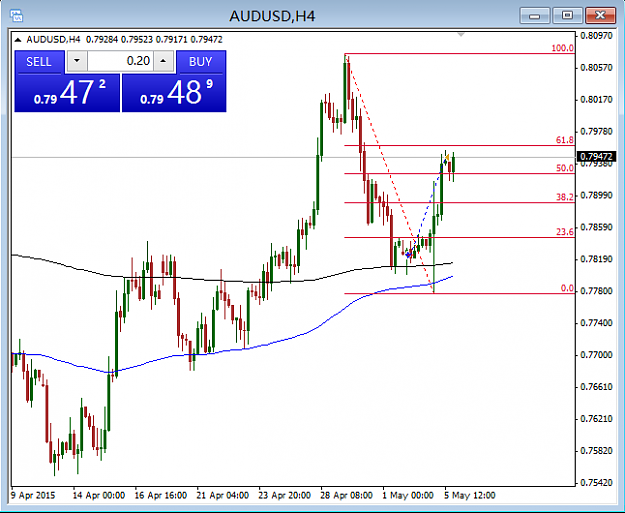
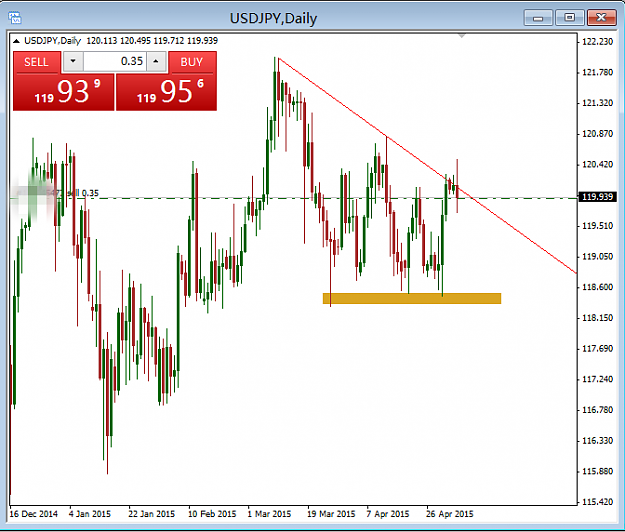
In my humble opinion,So-called Price Action is just the classical technical analysis which follows Dow Theory,the key is trend,define trend,find trend,use trend(follow or anti).What price gives us directly? Price patterns(bars) and swing highs/lows.Price patterns lead to top and bottom,swing highs/lows lead to trend lines and S/R lines.
BUT,the principle of trade is individual,the plan of trade is different.It depends on how we LOOK the things prices give us.right or wrong?! technical analysis is experiential,so does the price action.
BUT,the principle of trade is individual,the plan of trade is different.It depends on how we LOOK the things prices give us.right or wrong?! technical analysis is experiential,so does the price action.
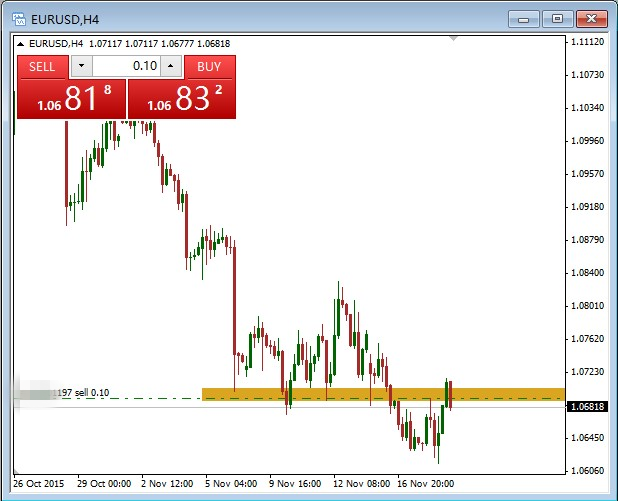
A chart helps those who can read it.