{quote} I remember this setup from your post early in January. I still like that channel concept. I see you use a method very similar to a video I happened to watch today. I wonder what you think of it (it's a bit long-winded so I used the right arrow quite a bit). https://www.youtube.com/watch?v=cvFvD3fNWvM
Ignored
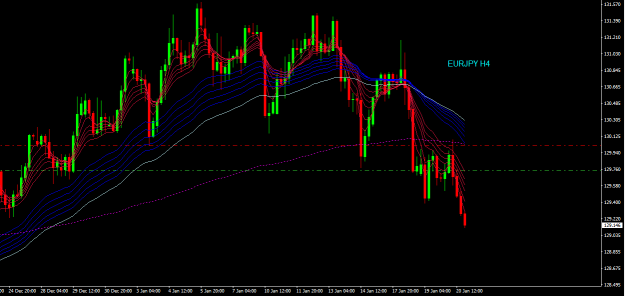
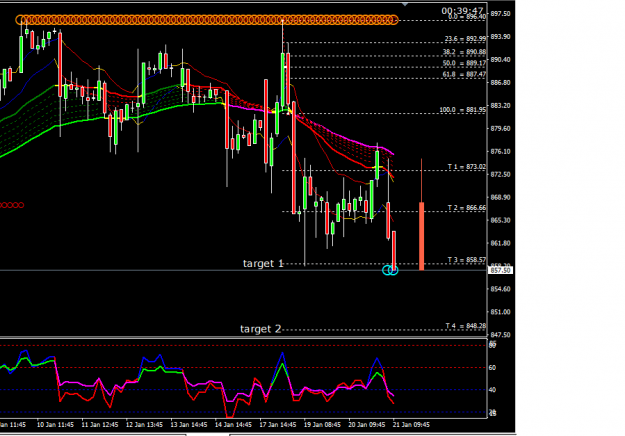
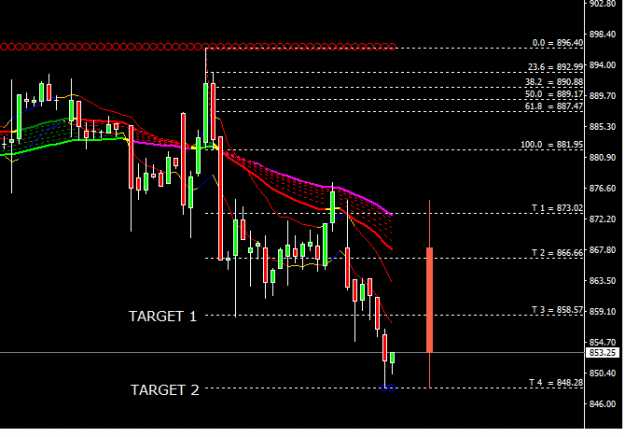
1) i look for fib retracements but dont use it to enter the trade as the author of the video does. a 50% retracement signifies a healthy trend formation.
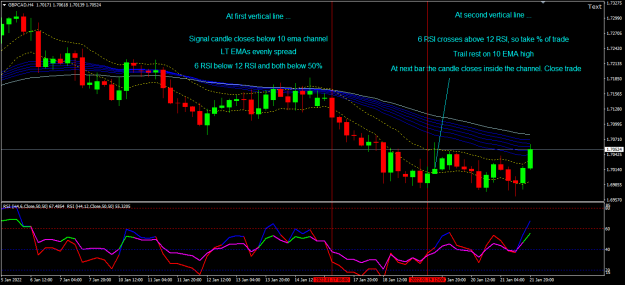
2) i always wait for candle to close beyond 10 ema chanel. candles are closing inside the chanel signify consolidation.
3) it ia always better to enter on the first pullback continuation pattern. the risk reward ratio is very good.
4) after entry as long as the candles are closing outside the chanel also signify a strong and healthy trend.
5) i use fibo expansion for target and chanel to trail my stoplosss.
so many ways fibo can help to know how healthy the trend is.
Attached Image (click to enlarge)
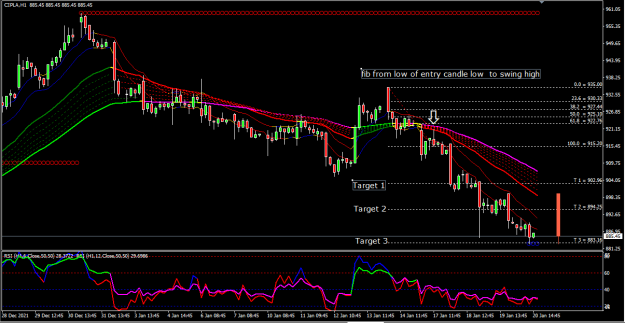
look at the last but 4 bullish candle. exact retracement to 61.8 % mark. still the close is out of the 10 ema channel. the rsi are still below one another and below 50. the next bearish candle opened at 61.8% resistance and closed well outside the 10 ema channel. this confirms a healthy downtrend.
if the retracement starts crossing the 50% mark and approaches the 38.2% mark i ususlly get out of the trade irrespective of the profit or loss. it means the trend is not healthy. find a better setup in another instrument rather than getting stuck in a choppy and uncertain trade.
first fibo was to see continuation pattern and get a good entry point
second fibo for target levels
third to make decision to stay in the trade or quit.
unlike the speaker in the video you posted Spudfun who is only looking at 50%, better to have a open mind and lateral thinking.
"The truth is that trading success is inside our minds and the holy grail is between our ears."
so many ways fibo can help to know how healthy the trend is.{image} look at the last but 4 bullish candle. exact retracement to 61.8 % mark. still the close is out of the 10 ema channel. the rsi are still below one another and below 50. the next bearish candle opened at 61.8% resistance and closed well outside the 10 ema channel. this confirms a healthy downtrend. if the retracement starts crossing the 50% mark and approaches the 38.2% mark i ususlly get out of the trade irrespective of the profit or loss. it means the trend is not healthy. find...
Ignored
Thank you for your comments here, Rajesh. I have never found the fibo very convincing - so many lines to choose from (23, 38, 50, etc), price has a high probability of reaching one of them. But the way you use it is just about ensuring the momentum of the trend is strong - you don't want a pullback to be the same size as the previous move down - that signals a weak trend. So that's why you want the pullback to stay at least below 50% and ideally below 38.2, and if it goes higher, you lose interest. And on top of that the 10 ema channel gives good confluence.
That's very useful insight.
I have a question about your entry. When do you decide that price is indeed continuing down again, and what kind of entry do you use and where?
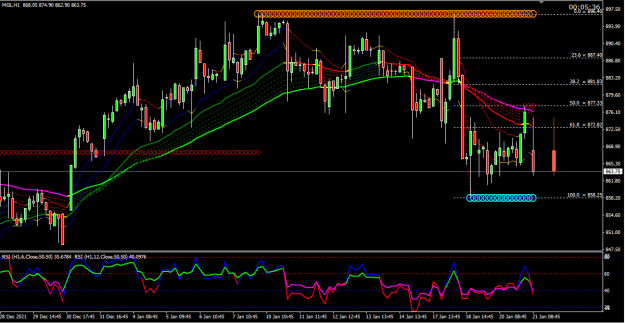
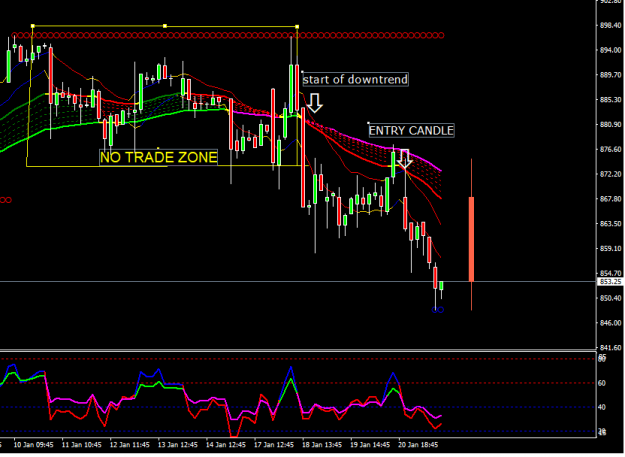
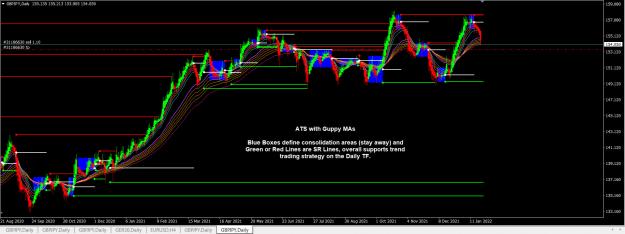
Yellow rectangle is no trade zone as price action is moving above and below Guppy LT EMAs
The start of down trend is when the Long term guppy cross . ie 30 ema crossses 60 ema down. (red ema 30 crossing below magenta ema 60)
At my entry candle : 1) all LT emas are evenly spread. this is the first criteria. if this is not fulfilled there is no trade.
2) the first candle to close below 10 ema channel.( if this is not fulfilled i consider it as a consolidation hence no trade)
3) rsi 6 should cross below rsi 12 at the same candle and both below 50.
4) supportive criteria but not mandatory : trend line break, flag formation, fib retracement less than 50.
identifying the first candle, ie first pullback continuation pattern after the start of the trend gives max profit in minimum time.
During trade : remain in trade till
all candle close outside 10 ema channel.
rsi 6 should remain below rsi 12.
if any of above fail, book partial profit and trail rest on ema 10 high.
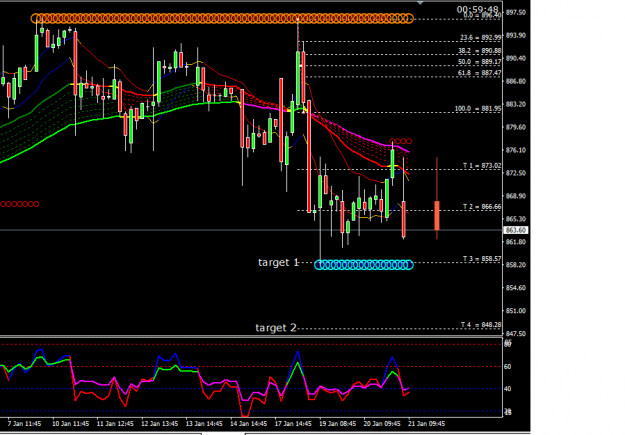
Targets as per fibo extension. T1 for 1 lot T2 book full priiofit.
Either trade futures or sell options. i never buy options because the time value detoriates significantly. in selling options time is your second best friend , first being the trend itself.
{quote} I have never found the fibo very convincing - so many lines to choose from (23, 38, 50, etc), price has a high probability of reaching one of them.
Ignored
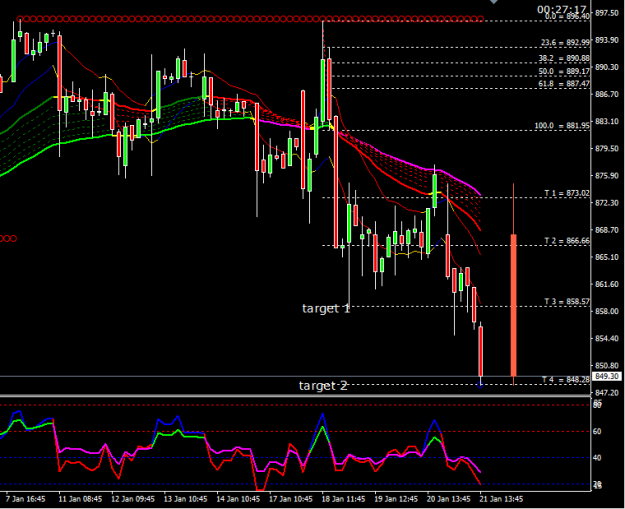
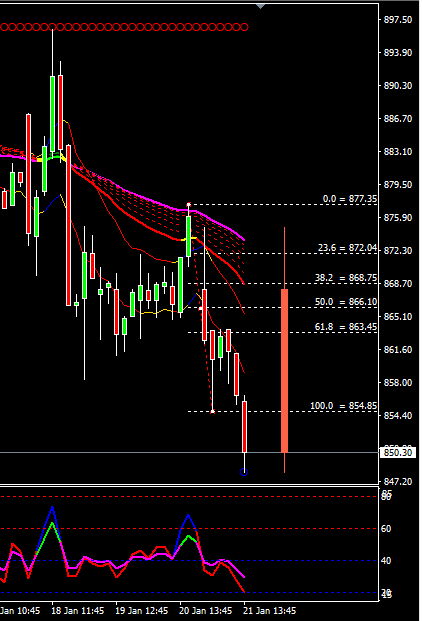
You will be surprised that today my second target on fibo was perfectly hit to the pip... and price slightly reversed at the close of market
most imp is that i had posted this pic during the trade itself. so if used wisely fibo is a excellent tool.
Yellow rectangle is no trade zone as price action is moving above and below Guppy LT EMAs The start of down trend is when the Long term guppy cross . ie 30 ema crossses 60 ema down. (red ema 30 crossing below magenta ema 60) At my entry candle : 1) all LT emas are evenly spread. this is the first criteria. if this is not fulfilled there is no trade. 2) the first candle to close below 10 ema channel.( if this is not fulfilled i consider it as a consolidation hence no trade) 3) rsi 6 should cross below rsi 12 at the same candle and both below 50....
Ignored
Hello!
How do you filter out assets? Do you go one by one or have some kind of screener?
i have only 2 indices and 7/8 stocks on my MT4 platform ( active liquid instruments, low spread and low margin requirement). i scan through the charts 15 min before the end of H1 candle till i find a good setup. I keep H1 and D1charts open and take future trades on H1 on completion of the candle. I sell options mostly on D1 timeframe. if i see setup developing on D1 I sell options without waiting for candle to close. i trade only one instrument at a time. so no scanner and no alerts are required. none of brokers in india allow trading from mt4 so no question of EA.
indian markets are open for 6 hrs a day. so rsi 6 and 12 are equivalent to rsi 1 and 2 on daily timeframe. so for me the daily candle price action is reflected on H1. For D1 charts i use rsi 5 and 10
Yellow rectangle is no trade zone as price action is moving above and below Guppy LT EMAs The start of down trend is when the Long term guppy cross . ie 30 ema crossses 60 ema down. (red ema 30 crossing below magenta ema 60) At my entry candle : 1) all LT emas are evenly spread. this is the first criteria. if this is not fulfilled there is no trade. 2) the first candle to close below 10 ema channel.( if this is not fulfilled i consider it as a consolidation hence no trade) 3) rsi 6 should cross below rsi 12 at the same candle and both below 50....
Ignored
I have tried a worked example based on the rules you provided here. I kept my LT Guppy lines as I normally have them. I also looked at the fibo tool but removed it from this chart because it made it very cluttered. The retracement did not breach the 61.8 line and the signal candle closed on the 23.6 line on its way down again, so that also ticked the right boxes. I note that price stopped its strong descent right on the first fibo extension - I think I'm going to look more seriously at this tool in future! Thank you for that.
i have only 2 indices and 7/8 stocks on my MT4 platform ( active liquid instruments, low spread and low margin requirement). i scan through the charts 15 min before the end of H1 candle till i find a good setup. I keep H1 and D1charts open and take future trades on H1 on completion of the candle. I sell options mostly on D1 timeframe. if i see setup developing on D1 I sell options without waiting for candle to close. i trade only one instrument at a time. so no scanner and no alerts are required. none of brokers in india allow trading from mt4 so...
Ignored
Thank you! This is interesting, because I find my attention spread between too many assets. So if I got you right, you only have 9-10 assets, but try to check them every hour 15m before the 1H candle close while the market is open? How many trades a week or a month do you find this way?
{quote} Thank you! This is interesting, because I find my attention spread between too many assets. So if I got you right, you only have 9-10 assets, but try to check them every hour 15m before the 1H candle close while the market is open? How many trades a week or a month do you find this way?
Ignored
all my assets are from different sectors so i am in trade every day. in fact i miss a lot of them because i focus on only one trade at a time.
trading is not my profession but i am learning as my retirement plan
{quote} Do you have any comments about my example? {image}
Ignored
absolutely perfect Spudfan.
1) This is the first pullback continuation pattern after the start of the downtrend. also price has again retraced into the LT cluster. this is a second pullback. IF again the candle closes below the 10 ema chanel you can go short again.IMP. Wait for price to enter inside the LT cluster and after that the candle closing outside 10 ema chanel is your entry. dont trade all or any candle closing outside the chanel.
nobody can anticipate how long this downtrend will last. but trades taken at the begining of the trend offer a good risk reward ratio.
2) also look at the candles before your entry candle. do they satisfy your pinch criteria ? i suggest you keep your original chart and add the 10 ema and rsi. hope you wont find your chart too cluttered after that
3) Fib retracement is a supporitng criteria but not mandatory for entering the trade. i use it always for setting targets.
{quote} all my assets are from different sectors so i am in trade every day. in fact i miss a lot of them because i focus on only one trade at a time. trading is not my profession but i am learning as my retirement plan
Ignored
So you have about 10 assets from different sectors, which gives you about 1 trade daily?
I'm in the same boat - working full time etc, but trying to fit trading into my daily routine.
{quote} So you have about 10 assets from different sectors, which gives you about 1 trade daily? I'm in the same boat - working full time etc, but trying to fit trading into my daily routine.