{quote} ... I confess that using GMMAs is not as easy as it looks, or I haven't found it so. I think it's because there aren't strict or clear rules. Daryl Guppy was clear that the GMMA is intended to be a guide to trend formation and continuation, not a specific trading strategy. I remain convinced that this is a good concept, just that I need to get my head around it ...
Ignored
After saying this I thought I should use the GMMAs as intended - as a guide to trends (but also looking out for when a "pinch" occurs) and then when a trend has been identified, to switch to my own MA crossover system that I am familiar with and has given me some good results at times. And when it didn't it was more my fault than the system.
But then walvekarraje posted the specific steps he uses and that also became a possibility - his and mine both have clear rules to be followed, which is good for me. So I think I'll use both for a while, probably in parallel and see how that goes.
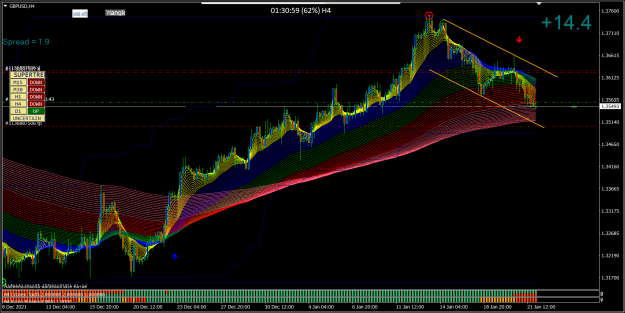
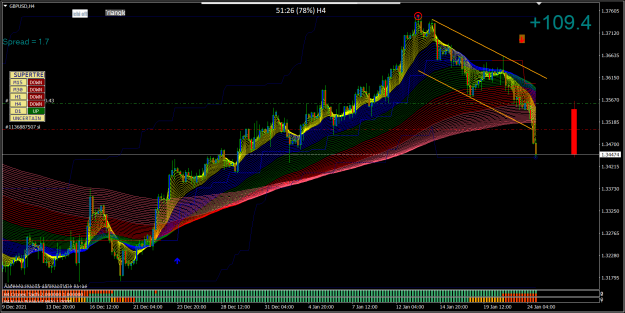
Following walvekarraje's method I placed a sell stop order at the base of the breakout candle. As far as I can see all the criteria have been met. A concern is that there is a support level not far below. This is where I have placed my target.
Following walvekarraje's method I placed a sell stop order at the base of the breakout candle. As far as I can see all the criteria have been met. A concern is that there is a support level not far below. This is where I have placed my target. {image}
Ignored
I usually dont look at support levels. if the trend is strong it will break the support and go further down. draw fibo extension and place your target orders. when price comes to support move stoploss to BE.
Attached Image (click to enlarge)
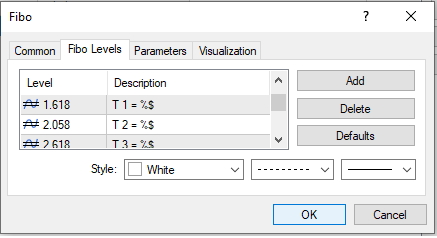
make these settings to mt4 fib tool
apply fib to the swing high and your breakout candle.
use of fib to check if trade is in your direction or not.
to stay in trade and carry your position for tomorrow ?
Attached Image (click to enlarge)
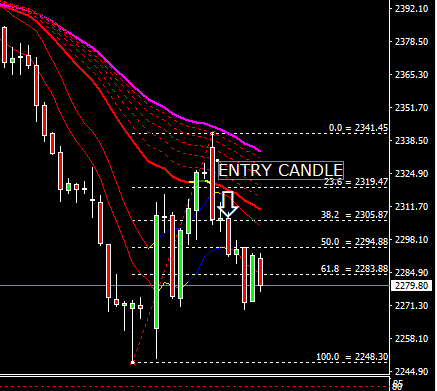
fib applied from previous swing low to swing high.
note that the bullish candle did not cross 50% mark.
and the last candle was bearish.
so the trend is intact.
so will carry trade for tomorrow.
now that todays close is fairly away fron my entry price, i will shift my stoploss to BE tomorrow at market open. this way even if market reverses tomorrow at least i will not loose money.
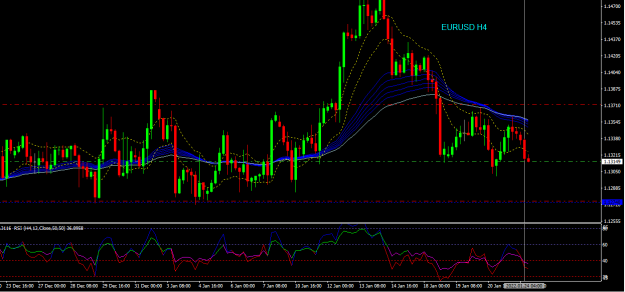
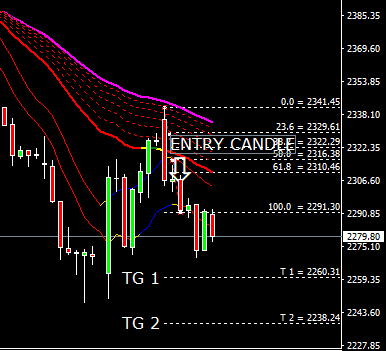
now the fib is applied from the low of breakout/ entry candle (candle closing below ema chanel) to the previous swing high.
note that target 1 is above the previous support and target 2 is below it. if the trend is strong the probablity of hitting targets is fairly high.
finally tomorrow after market open if price retraces above 50% and/or my BE stoploss is hit.... i will be out of the trade.
if not i will wait for my targets.
{quote} so many lines to choose from (23, 38, 50, etc), price has a high probability of reaching one of them.
Ignored
what you say Spudfan is absolutely right. " price has a high probability of reaching one of them." if you can use the fib tool correctly the probablity of hitting targets is also very high
fib to set targets {image} now the fib is applied from the low of breakout/ entry candle (candle closing below ema chanel) to the previous swing high. note that target 1 is above the previous support and target 2 is below it. if the trend is strong the probablity of hitting targets is fairly high. finally tomorrow after market open if price retraces above 50% and/or my BE stoploss is hit.... i will be out of the trade. if not i will wait for my targets.
Ignored
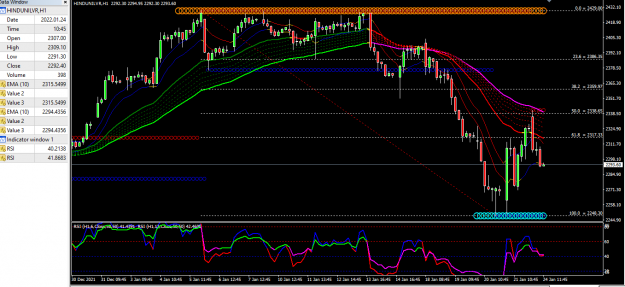
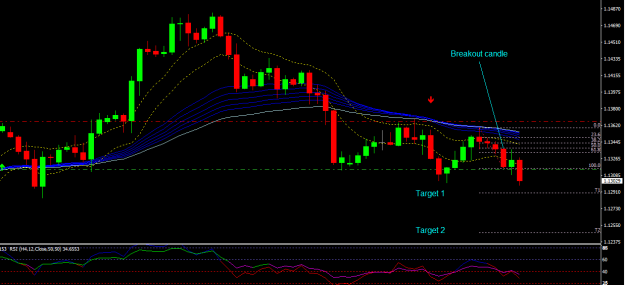
Like this? (This is the same EURUSD H4 trade as recently posted).
{quote} Like this? (This is the same EURUSD H4 trade as recently posted). {image}
Ignored
it looks that the price is significantly away from your entry. also the wick has crossed your previous support. so time to move stoploss to BE.
Book profit 1) targets reached 2) the 6 rsi goes below 20 level .
you can opt to remain in trade till rsi 6 is below rsi 12 or candles are closing outside ema chanels
{quote} it looks that the price is significantly away from your entry. also the wick has crossed your previous support. so time to move stoploss to BE. Book profit 1) targets reached 2) the 6 rsi goes below 20 level . you can opt to remain in trade till rsi 6 is below rsi 12 or candles are closing outside ema chanels
Ignored
I wouldn't say that price is significantly away from the entry - it's about 16 pips away, not even 1R yet. Let me go back and look for your exit rules. That might help clarify.
I found this below, my comments in blue
During trade : remain in trade till
all candle close outside 10 ema channel. So in a sell trade, if the entire candle, body, wicks, the lot closes BELOW the channel we close 100% of the trade, is that a correct understanding? That doesn't sound right. I think you mean all candles in a sell trade should CLOSE below the channel, so if they don't, we book partial profit. That sounds better!
rsi 6 should remain below rsi 12. So if the 6 RSI closes above the 12 rsi, we exit 100%? No, I'm wrong I think. We should take partial profit?
if any of above fail, book partial profit and trail rest on ema 10 high.
Targets as per fibo extension. T1 for 1 lot T2 book full profit. So the targets apply if none of the above things go wrong and the trade survives?
{quote} I wouldn't say that price is significantly away from the entry - it's about 16 pips away, not even 1R yet. Let me go back and look for your exit rules. That might help clarify. I found this below, my comments in blue During trade : remain in trade till all candle close outside 10 ema channel. So in a sell trade, if the entire candle, body, wicks, the lot closes BELOW the channel we close 100% of the trade, is that a correct understanding? That doesn't sound right. I think you mean all candles in a sell trade should CLOSE below the channel,...
Ignored
"I wouldn't say that price is significantly away from the entry - it's about 16 pips away, not even 1R yet" - sorry, i was just trying to read your chart, i really didnt read the figures.
in a sell trade as long as the candle closes below the 10 low ema . the trend is strong even if it is a bullish candle. so remain in the trade.
in a sell trade if rsi 6 closes above rsi 12, but as long as both are below 50, you can still be in trade but you need to watch the price action and decide accordingly.
but if rsi 6 closes above 50 . definately book profits, partial or total depends on you.
i like to take fibo targets because if you are trailing, it takes a lot of time for the 10 high ema ( in a sell trade) to reach that level and you may get stopped in between.
rules are guidelines ....... after all " the holy grail is between our ears."
{quote} "I wouldn't say that price is significantly away from the entry - it's about 16 pips away, not even 1R yet" - sorry, i was just trying to read your chart, i really didnt read the figures. in a sell trade as long as the candle closes below the 10 low ema . the trend is strong even if it is a bullish candle. so remain in the trade. in a sell trade if rsi 6 closes above rsi 12, but as long as both are below 50, you can still be in trade but you need to watch the price action and decide accordingly. but if rsi 6 closes above 50 . definately...
Ignored
Thank you that really helps - that holy grail between my ears doesn't always do as I want it to.
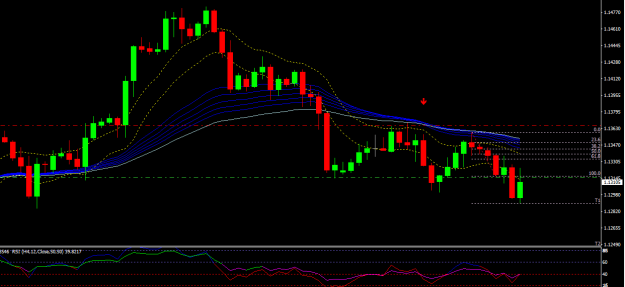
Hey Rajesh, you did say that price sometimes reacts precisely to fibo levels. Well, how's this? Even though it seems such a random thing, it reacted almost exactly. Like magic. I was out when price reached T1, and you can see what happened.
Taking partial profits is a problem for me because I don't think one can set partial targets on MT4, so it has to be done manually. If anyone knows how to set them via MT4 please share it.