• Home
  • Forums
  • Trades
  • News
  • Calendar
  • Market
  • Brokers
  • Login
  • Join
  • User/Email: Password:
  • 4:53am
Menu
  • Forums
  • Trades
  • News
  • Calendar
  • Market
  • Brokers
  • Login
  • Join
  • 4:53am
Sister Sites
  • Metals Mine
  • Energy EXCH
  • Crypto Craft

Options

Bookmark Thread

First Page First Unread Last Page Last Post

Print Thread

Similar Threads

Monitor for 'Trading Made Simple' system 553 replies

Trading Made Simple the right way, and other trading lessons 318 replies

MTF Indicators for the 'Trading Made Simple' system 240 replies

Indicators for the 'Trading Made Simple' system 342 replies

Trading Made Simple system follower - Thanks to eelfranz 9 replies

  • Trading Systems
  • /
  • Reply to Thread
  • Subscribe
  • 56,303
Attachments: Trading Made Simple
Exit Attachments

Trading Made Simple

  • Last Post
  •  
  • 1 64366437Page 643864396440 6594
  • 1 Page 6438 6594
  •  
  • Post #128,741
  • Quote
  • Jan 18, 2022 6:32am Jan 18, 2022 6:32am
  •  Spudfan
  • | Joined Apr 2017 | Status: Member | 209 Posts
Quoting emmanuel7788
Disliked
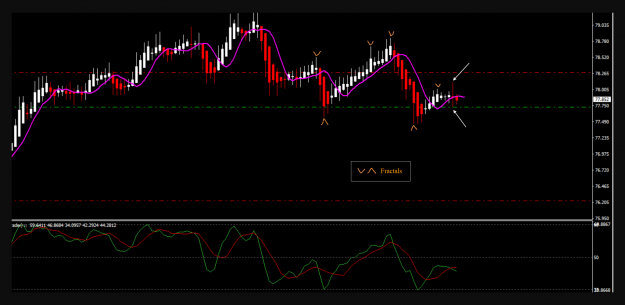
{quote} good observations. I look at the swing highs and swing lows with Fractals ... that big bar/candle is in question ... I would not take that trade. {image} ...
Ignored
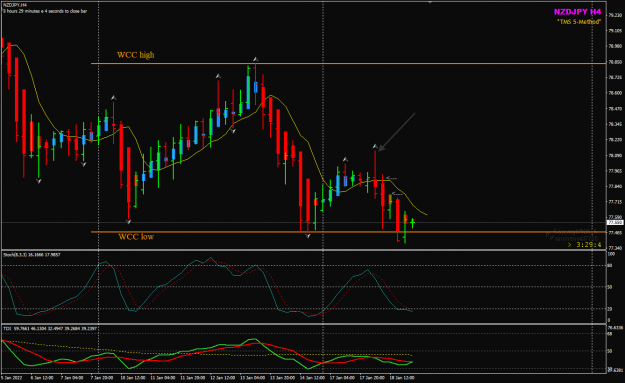
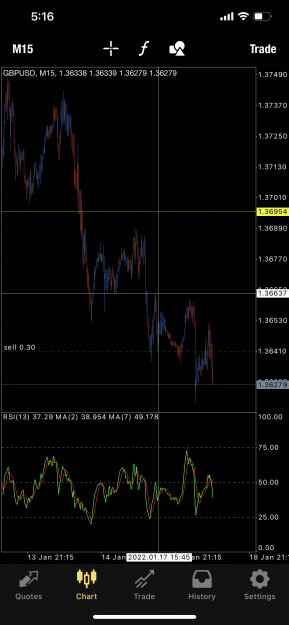
Emmanuel, could you explain what it is about that big candle that you don't like? Thanks.
 
 
  • Post #128,742
  • Quote
  • Jan 18, 2022 11:54am Jan 18, 2022 11:54am
  •  Spudfan
  • | Joined Apr 2017 | Status: Member | 209 Posts
I could get used to this. In addition to the NZDJPY trade I posted about earlier I placed four others. I have just closed all of them. I'm still using a small lot size while I get used to it, but if I scale up I would have made around 3% for the day.

What I have done is trade a basket of trades. Instead of working with each one individually, I treat them as a collective, so if the total profit for my day (at or just before London market close) is anywhere above 2% I will close up for the day and sleep peacefully. I don't like holding active trades overnight if I can help it, so this approach is something that works for me very nicely. I have experienced this "basket trading" approach before with a system that generated a good number of trades in a day, say 5 to 7 trades. I have found that they would often all go into profit together but the longer I left them (to let my profits run) the more one of more would start losing steam and end up with a loss. When this happens it usually means that my total for the day almost never reaches what it was when they were all together.
 
 
  • Post #128,743
  • Quote
  • Jan 18, 2022 5:37pm Jan 18, 2022 5:37pm
  •  emmanuel7788
  • Joined Nov 2008 | Status: Member | 36,523 Posts
Quoting Spudfan
Disliked
{quote} Emmanuel, could you explain what it is about that big candle that you don't like? Thanks.
Ignored
Attached Image (click to enlarge)
Click to Enlarge

Name: NJ spudfan post chart 18-1-2022 7-18-10 pm.png
Size: 105 KB


with that big bar/candle at the time of your entry, the swing high was not confirmed.

it need two bars/candle after to close with lower highs for the fractal (high) to form and confirm a swing high.


Attached Image (click to enlarge)
Click to Enlarge

Name: NJ Jan18 H4 swing high review 19-1-2022 6-30-57 am.png
Size: 40 KB
Honesty is a very expensive gift. You wont find it in cheap people.WBuffett
1
 
  • Post #128,744
  • Quote
  • Edited at 5:28am Jan 19, 2022 2:21am | Edited at 5:28am
  •  Spudfan
  • | Joined Apr 2017 | Status: Member | 209 Posts
Quoting emmanuel7788
Disliked
{quote} {image} with that big bar/candle at the time of your entry, the swing high was not confirmed. it need two bars/candle after to close with lower highs for the fractal (high) to form and confirm a swing high. {image}
Ignored
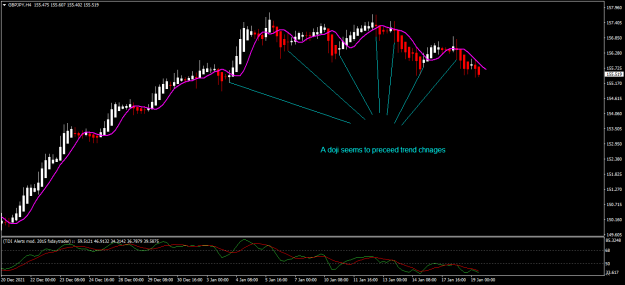
Thank you. I don't use fractals, so is there anything using the theory of HA candles or plain PA that would signal caution around that big candle?

The reason I am asking is that it seems that a doji signals a trend change in most cases. [EDIT: Whenever there is a trend change, in most cases a doji appears at the change]. So I want to work out if there is something about those dojis that tells me more, for example are smaller ones less significant than larger ones etc?
Attached Image (click to enlarge)
Click to Enlarge

Name: doj.png
Size: 25 KB
 
 
  • Post #128,745
  • Quote
  • Jan 19, 2022 2:38am Jan 19, 2022 2:38am
  •  leekeyne
  • | Joined Dec 2018 | Status: Member | 14 Posts
Quoting Spudfan
Disliked
{quote} Thanks you. I don't use fractals, so is there anything using the theory of HA candles or plain PA that would signal caution around that big candle?
Ignored
The basis of PA is the interaction between ranges and trends. If you trade a trend long, you watch out for Higher Highs, Higher Lows (swing points). If you trade short, you watch out for lower highs and lower lows. You also want to take a look at what the candles within the trends or ranges portray, are they small or large, do they have large bodies or large wicks (like the big candle in your trade)? So what does the big candle mean in you trade? It made a spike up and a spike down, meaning buyers were trying to push it up, but failed, and at the same time sellers were trying to push price down, but failed as well. So there is a price action stalemate and no clear direction. If I trade a setup, I want to have clear confirmed direction. These are my two cents. (correct me if I am wrong Emmanuel).
 
1
  • Post #128,746
  • Quote
  • Jan 19, 2022 5:42am Jan 19, 2022 5:42am
  •  tommydoginti
  • Joined Oct 2020 | Status: Member | 2,273 Posts
Quoting Ttxiii
Disliked
Hey guys Had a question, do you think it would be possible to use currency strength with the TMS Strategy so you know whats in a trend or not? And how do you guys use HTF analysis with TMS? Like example: If you have entries on the 4H TF and you need to know the direction of the 1D TF can you guys explain how you guys do it and what do you use?
Ignored
Hi Ttxiii,

I missed your PM.

You asked about the reason of not using HTF. It is because the HHHL, LHLL pattern is sufficient to obtain information of trend. If you trade like BigE where he catch a swing (he exited at any pullback), then the long term trend is not super important (he traded both trend following and countertrend). On the contrary, HTF can get in your way and miss some valid setups.

A few examples of trades following HHHL, LHLL. You have to develop your rules. It can be strictly following a rigid HHHL/LHLL pattern, or conditions where you can stay your bias at slight violation.

Remember I just showed you one PA elements, there are others you can apply in your trading
Attached Image (click to enlarge)
Click to Enlarge

Name: screenshot.png
Size: 40 KB


Good luck.
 
1
  • Post #128,747
  • Quote
  • Jan 19, 2022 5:44am Jan 19, 2022 5:44am
  •  tommydoginti
  • Joined Oct 2020 | Status: Member | 2,273 Posts
Quoting tommydoginti
Disliked
{quote} Hi Ttxiii, I missed your PM. You asked about the reason of not using HTF. It is because the HHHL, LHLL pattern is sufficient to obtain information of trend. If you trade like BigE where he catch a swing (he exited at any pullback), then the long term trend is not super important (he traded both trend following and countertrend). On the contrary, HTF can get in your way and miss some valid setups. A few examples of trades following HHHL, LHLL. You have to develop your rules. It can be strictly following a rigid HHHL/LHLL pattern, or conditions...
Ignored
Attached Image (click to enlarge)
Click to Enlarge

Name: D949541C-2D72-4730-AFF6-4F059E4E00E3.png
Size: 376 KB
Attached Image (click to enlarge)
Click to Enlarge

Name: 5552B381-BAC6-42FE-BB13-0C235EA99C5A.png
Size: 381 KB
Attached Image (click to enlarge)
Click to Enlarge

Name: 16B79AAF-10BC-496F-B3A3-70DE7AC07EA1.png
Size: 377 KB
Attached Image (click to enlarge)
Click to Enlarge

Name: D056674C-101B-44F9-A620-DC94A3BDB46C.png
Size: 399 KB
 
 
  • Post #128,748
  • Quote
  • Jan 19, 2022 6:26am Jan 19, 2022 6:26am
  •  emmanuel7788
  • Joined Nov 2008 | Status: Member | 36,523 Posts
Quoting Spudfan
Disliked
{quote} Thank you. I don't use fractals, so is there anything using the theory of HA candles or plain PA that would signal caution around that big candle? The reason I am asking is that it seems that a doji signals a trend change in most cases. [EDIT: Whenever there is a trend change, in most cases a doji appears at the change]. So I want to work out if there is something about those dojis that tells me more, for example are smaller ones less significant than larger ones etc? {image}
Ignored
price fractals are alway on your charts even when you do not use an indicator to show them.

the core of Big E' 5-Method is based on the Natural Flow of the Market forex system by Craig Harris and the swing highs and swing lows are with price fractals.

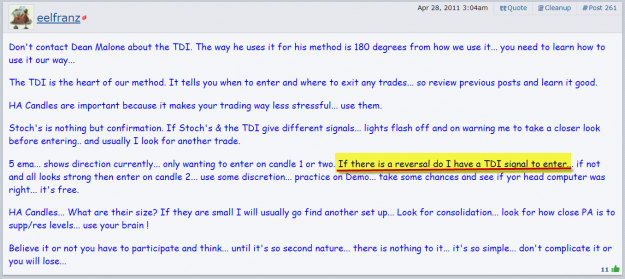
the True Reversal is based on 5 bars fractal ... with bars 1,2,3,4 and 5.
bar5 must always close above or below bar1.

without a true reversal as mentioned in Post#261, there is no trade setup. The TDI RSI green price line is just a filter to pick the price momentum of bar5.

Attached Image (click to enlarge)
Click to Enlarge

Name: Post #261.png
Size: 127 KB


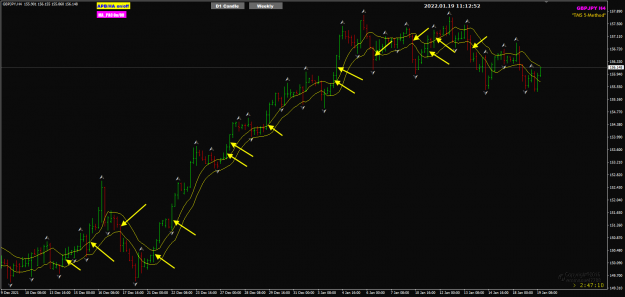
GJ H4 Jan 19

- lots of setups ... reversal and continuation, seen with the APB/HA candle turned off.

Attached Image (click to enlarge)
Click to Enlarge

Name: GJ Jan19 H4 PAC 19-1-2022 7-12-54 pm.png
Size: 54 KB
Honesty is a very expensive gift. You wont find it in cheap people.WBuffett
1
1
  • Post #128,749
  • Quote
  • Jan 19, 2022 6:36am Jan 19, 2022 6:36am
  •  emmanuel7788
  • Joined Nov 2008 | Status: Member | 36,523 Posts
Quoting leekeyne
Disliked
{quote} The basis of PA is the interaction between ranges and trends. If you trade a trend long, you watch out for Higher Highs, Higher Lows (swing points). If you trade short, you watch out for lower highs and lower lows. You also want to take a look at what the candles within the trends or ranges portray, are they small or large, do they have large bodies or large wicks (like the big candle in your trade)? So what does the big candle mean in you trade? It made a spike up and a spike down, meaning buyers were trying to push it up, but failed, and...
Ignored
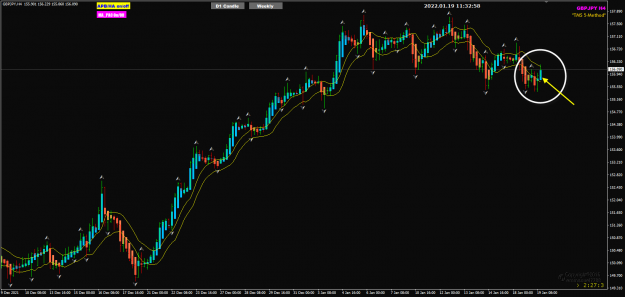
GJ H4 Jan 19

- now watch this H4 candle close and see if we have a setup

- it can be so simple ... just need DISCIPLINE to execute the trade setups


Attached Image (click to enlarge)
Click to Enlarge

Name: GJ H4 Jan 19 19-1-2022 7-32-59 pm.png
Size: 54 KB


...
Honesty is a very expensive gift. You wont find it in cheap people.WBuffett
1
 
  • Post #128,750
  • Quote
  • Jan 19, 2022 6:45am Jan 19, 2022 6:45am
  •  blueman
  • Joined Jan 2010 | Status: Member | 181 Posts
Quoting emmanuel7788
Disliked
{quote} GJ H4 Jan 19 - now watch this H4 candle close and see if we have a setup - it can be so simple ... just need DISCIPLINE to execute the trade setups {image} ...
Ignored
Where can I find those indicators with the on/off ? thx
 
 
  • Post #128,751
  • Quote
  • Jan 19, 2022 6:50am Jan 19, 2022 6:50am
  •  emmanuel7788
  • Joined Nov 2008 | Status: Member | 36,523 Posts
Quoting emmanuel7788
Disliked
{quote} US30 Jan 14 trades closed - meet my daily target - closed shop now for early night. {image} ...
Ignored

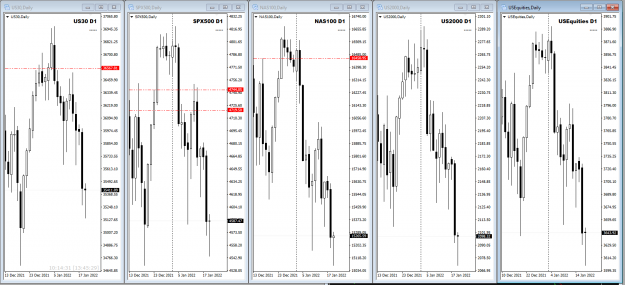
US Markets Jan 19 Daily

- nice pull back during London session

- can it move further up and close bull today?

> careful at NY 9:30am candle (Chicago open)

Attached Image (click to enlarge)
Click to Enlarge

Name: US Markets Jan19 Daily LS 19-1-2022 7-45-29 pm.png
Size: 49 KB


...
Honesty is a very expensive gift. You wont find it in cheap people.WBuffett
1
 
  • Post #128,752
  • Quote
  • Edited at 7:30am Jan 19, 2022 6:57am | Edited at 7:30am
  •  Spudfan
  • | Joined Apr 2017 | Status: Member | 209 Posts
Quoting emmanuel7788
Disliked
{quote} GJ H4 Jan 19 - now watch this H4 candle close and see if we have a setup - it can be so simple ... just need DISCIPLINE to execute the trade setups {image} ...
Ignored
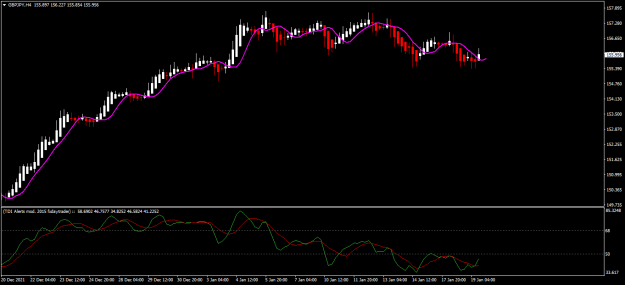
On H4 we have a buy signal from the TDI, but this pair is in a weak downtrend, several lower swing points, so I would assume this is either a short-tern buy or a sit-on-your-hands.

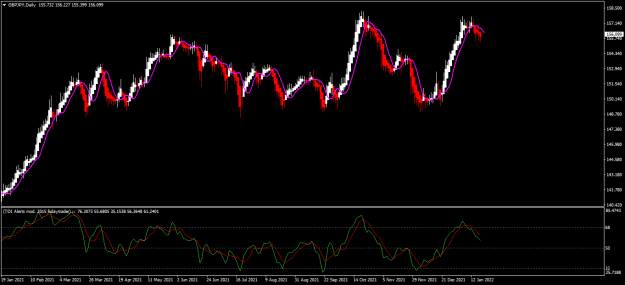
But the daily chart looks like price has reached (almost reached) a key level and is currently busy reversing. I have been watching this pair for a few days and have resisted buying.

Attached Image (click to enlarge)
Click to Enlarge

Name: gbpjpy H4.png
Size: 22 KB
Attached Image (click to enlarge)
Click to Enlarge

Name: gbpjpy.png
Size: 29 KB
 
 
  • Post #128,753
  • Quote
  • Jan 19, 2022 11:59am Jan 19, 2022 11:59am
  •  leekeyne
  • | Joined Dec 2018 | Status: Member | 14 Posts
Question for Emmanuel:

Could you breakdown how you use the ADR trailing stop loss when you trade daily charts? I am having a hard time with the exits as there is so much discretion involved there. Having read the first 40 pages from Big E so far, my summary of Big E's exit rules are:

  1. TDI becoming flat
  2. Rollovers/Hooks
  3. Checkmarks
  4. TDI line crossing red line towards opposite trading direction (could be opposite entry signal sometimes)
  5. PA Ranging after multiple candles (e.g. small candles forming)
  6. Candles with long wicks in your trading direction (PA showing weakness and losing momentum)

Now here is the problem for me. When the TDI becomes flat or rolls over or when candles are ranging etc., I am never sure whether it's just some normal consolidation / pullback before the market continues in my direction, or whether a reversal is incoming. Therefore I would personally prefer a more mechanical exit rule such as a fixed trailing SL. Is your ADR trailing SL strategy something like that or do you have any suggestions for a fixed exit strategy?

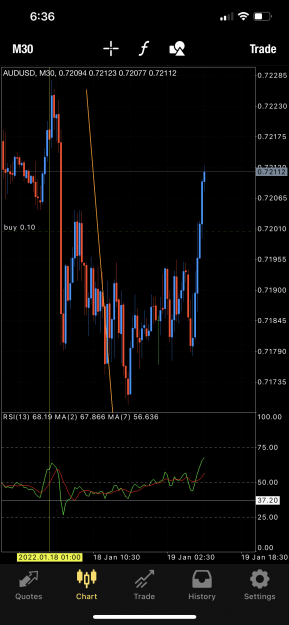
I have a specific example as well. Look at the attached chart: So I am still in the AUDJPY daily chart based trade. I initially set the TP : SL ratio as 2:1. However now the market has started ranging and the TDI is flat. The question that keeps nagging me now is, should I exit or give it more time and just let it play out mechanically (either SL or TP hit) or set a more dynamic trailing SL? The amount of exit options make me indecisive about what to do.

Attached Image (click to enlarge)
Click to Enlarge

Name: Bildschirmfoto 2022-01-19 um 17.54.27.png
Size: 242 KB
 
 
  • Post #128,754
  • Quote
  • Jan 19, 2022 12:14pm Jan 19, 2022 12:14pm
  •  KCJed
  • | Joined Feb 2021 | Status: Member | 23 Posts
Hi Emmanuel,

Thanks for all your input on here. I've seen an APB on/off button on your screen. Can you point me in the right direction as to where to get it please. I can't seem to find it. I looked on the buttons link you posted...maybe I'm just missing it. It would be greatly appreciated. Thanks, mate.
 
 
  • Post #128,755
  • Quote
  • Jan 19, 2022 2:40pm Jan 19, 2022 2:40pm
  •  cpfleger
  • | Joined Jul 2015 | Status: Member | 57 Posts
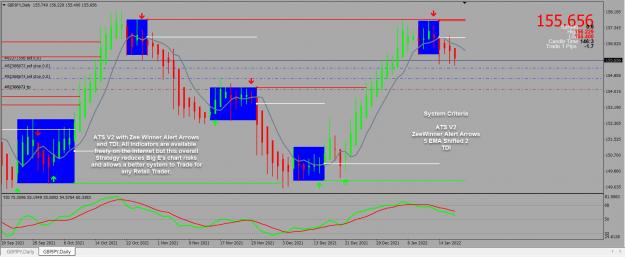
After years of reading, testing and applying various Indicators and of course finding these Indicators around the globe, this is my 2022 System... Clean and simple to use.
Attached Image (click to enlarge)
Click to Enlarge

Name: ATS V2 and System.jpg
Size: 343 KB
 
1
  • Post #128,756
  • Quote
  • Jan 19, 2022 5:17pm Jan 19, 2022 5:17pm
  •  neilpryde
  • | Joined Dec 2009 | Status: Member | 22 Posts
Quoting cpfleger
Disliked
After years of reading, testing and applying various Indicators and of course finding these Indicators around the globe, this is my 2022 System... Clean and simple to use. {image}
Ignored
Hi,
Your system looks really intresting ! Can you share some more ideas how to use it ? Do you use it only on D1.
I could not finde zee winner alert arrow, could you share it ?
Thanks in advance
 
 
  • Post #128,757
  • Quote
  • Jan 19, 2022 5:26pm Jan 19, 2022 5:26pm
  •  cpfleger
  • | Joined Jul 2015 | Status: Member | 57 Posts
Neil, as requested and enjoy.
Attached Files
File Type: ex4 ZWinnerAlert (Andrea).ex4   16 KB | 205 downloads
File Type: ex4 TDI Red Green.ex4   16 KB | 167 downloads
File Type: ex4 Pip Counter (Andrea).ex4   20 KB | 167 downloads
File Type: ex4 ATS V2.0 User.ex4   32 KB | 201 downloads
File Type: tpl Basic ATS V2.tpl   103 KB | 180 downloads
 
2
  • Post #128,758
  • Quote
  • Jan 19, 2022 5:44pm Jan 19, 2022 5:44pm
  •  cpfleger
  • | Joined Jul 2015 | Status: Member | 57 Posts
Neil, this system can be used on any TF but 1 hour and above gets the best steady results.
 
 
  • Post #128,759
  • Quote
  • Jan 20, 2022 1:20am Jan 20, 2022 1:20am
  •  markrekt
  • Joined Oct 2021 | Status: Member | 261 Posts
Quoting cpfleger
Disliked
Neil, as requested and enjoy. {file} {file} {file} {file} {file}
Ignored
Hi CPfleger,
Do you have instruction of how to use these indicators, ie. ATS, ZWinner
Trading TMS Classic Way - https://www.forexfactory.com/thread/1114833
 
 
  • Post #128,760
  • Quote
  • Jan 20, 2022 3:30am Jan 20, 2022 3:30am
  •  cpfleger
  • | Joined Jul 2015 | Status: Member | 57 Posts
markrekt,
if possible watch on youtube ATS video's and if you have read Big Ed's pdf you will see the Blue Rectangle Boxes as Consolidation Areas (stay out of the market time) and the White and Green / Red Lines as opportunities to trade with Red or Green Arrows, follow the MA Line and when the candle Body touches the MA exit the trade. Practice on a Demo using 1 Hour TF firstly and then go upwards to the Daily to extend your new skill and pips.
 
 
  • Trading Systems
  • /
  • Trading Made Simple
  • Reply to Thread
    • 1 64366437Page 643864396440 6594
    • 1 Page 6438 6594
5 traders viewing now, 1 is a member:
26tut
  • More
Top of Page
Forex Factory Blog Updated: Alerting All Members
  • Facebook
  • Twitter
About FF
  • Mission
  • Products
  • User Guide
  • Media Kit
  • Blog
  • Contact
FF Products
  • Forums
  • Trades
  • Calendar
  • News
  • Market
  • Brokers
  • Trade Explorer
FF Website
  • Homepage
  • Search
  • Members
  • Report a Bug
Follow FF
  • Facebook
  • Twitter

FF Sister Sites:

  • Metals Mine
  • Energy EXCH
  • Crypto Craft

Forex Factory® is a brand of Fair Economy, Inc.

Terms of Service / ©2022