Hello dear Bionic Traders,
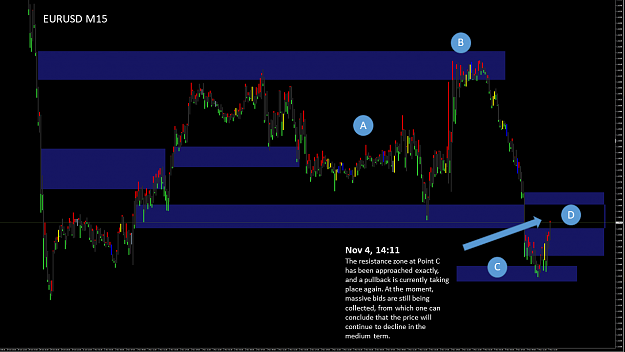
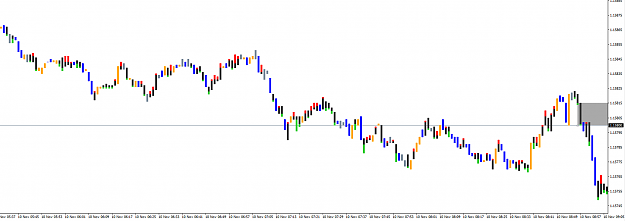
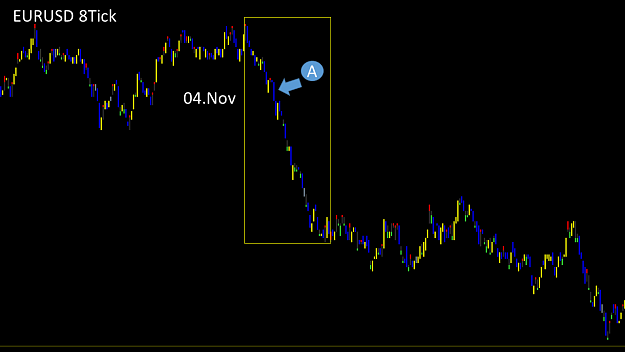
My assessment of 14:11 yesterday at noon that the price will go down again has been fulfilled with 45 pip, but I had not drawn the zone correctly.
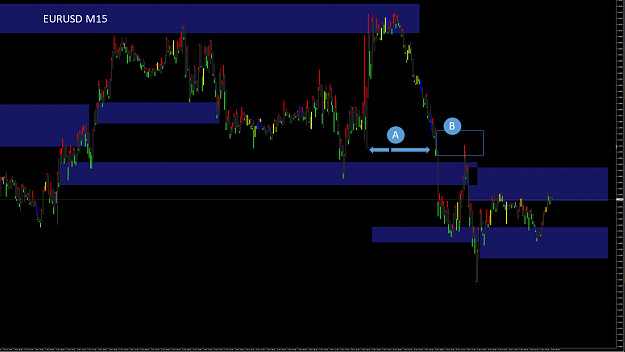
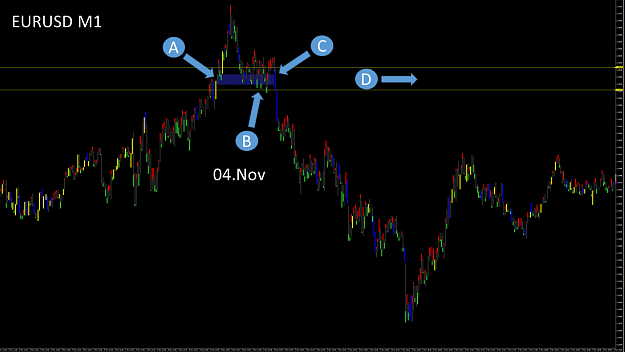
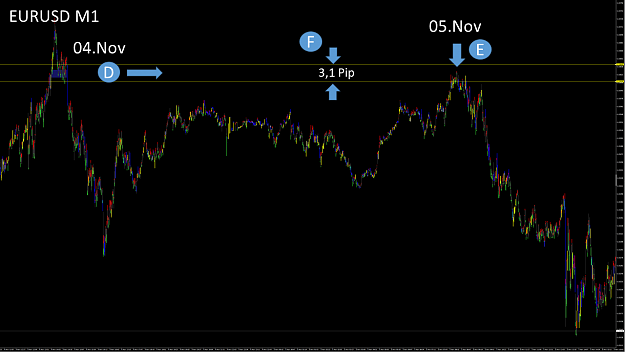
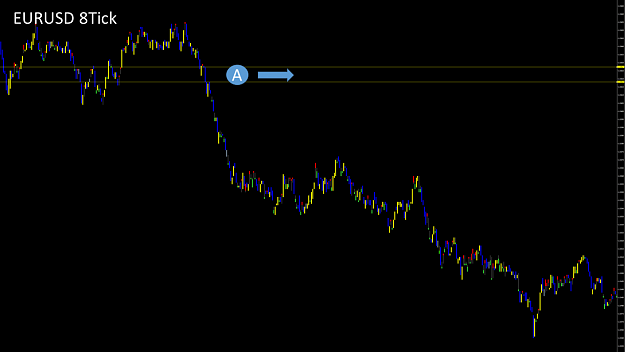
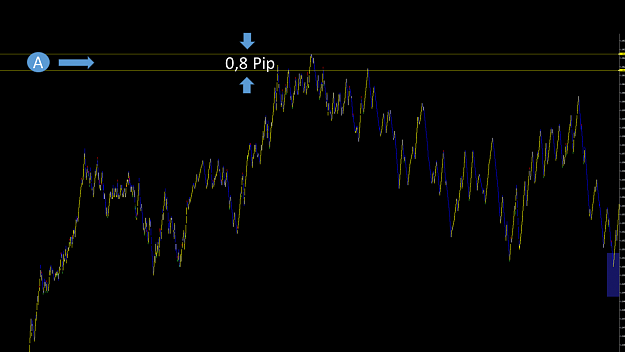
At point A, we see the price turned sharply upwards. The key candle at Point B took out this strong movement and would therefore have been the right zone.
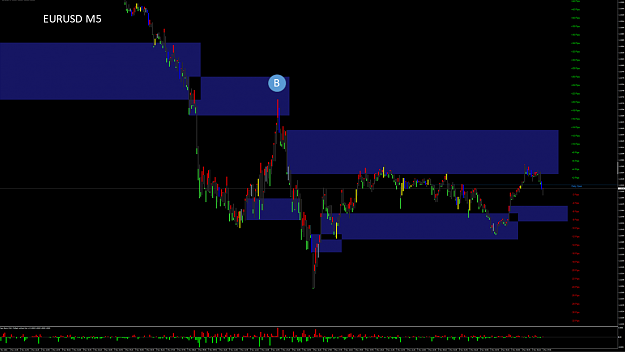
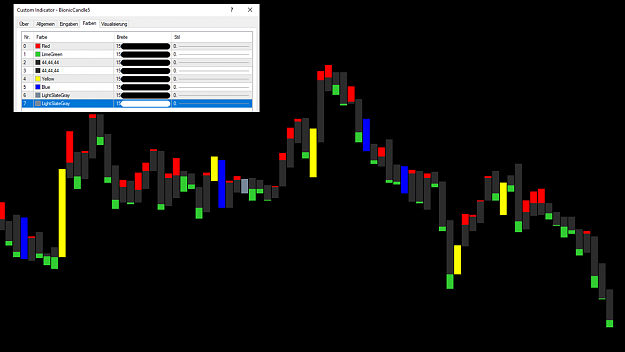
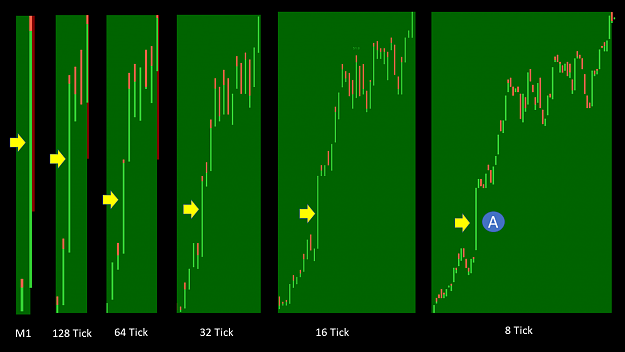
In the M5, this assessment would have been easier and clearer. This is simply due to the fact that the candles are formed randomly based on the time and of course there is a better overview in smaller time units. This can always lead to misinterpretations. The bionic candle is not a Holy Grail, because if it were, the stock market would no longer work in the future. But it can help us to find more entry points, as well as the optimal exit. I would also recommend at the beginning not to make the mistake of focusing exclusively on the Bionic candle. Since you don't know the candle yet, there are many mistakes, which ultimately leads to frustration. Let the bionic candle run in your chart and draw your zones along the way. This will show you, how the Bionic candle works and you will also find further entry points.
I wish you a successful trading day.
Best regards Michael
Attached Image (click to enlarge)
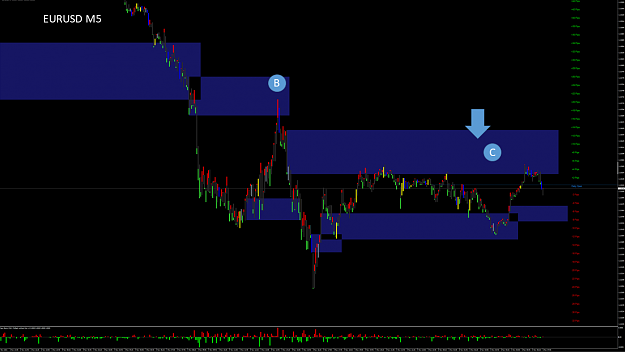
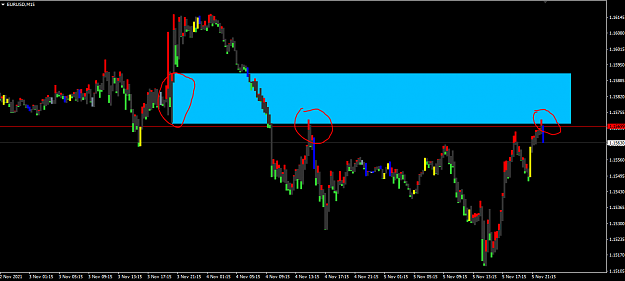
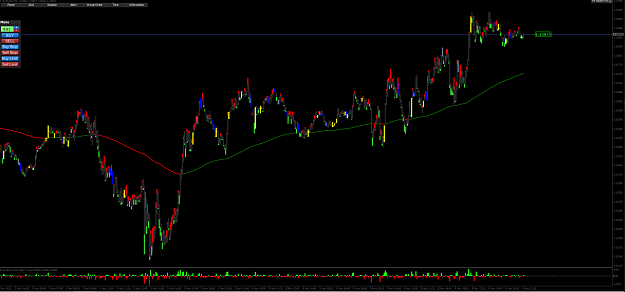
My assessment of 14:11 yesterday at noon that the price will go down again has been fulfilled with 45 pip, but I had not drawn the zone correctly.
Attached Image (click to enlarge)
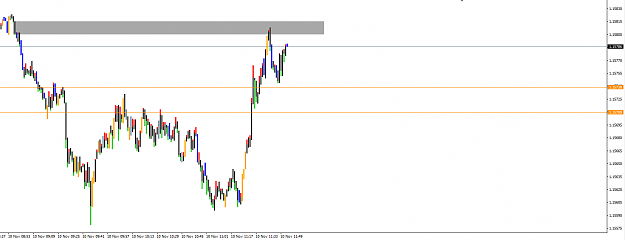
At point A, we see the price turned sharply upwards. The key candle at Point B took out this strong movement and would therefore have been the right zone.
Attached Image (click to enlarge)
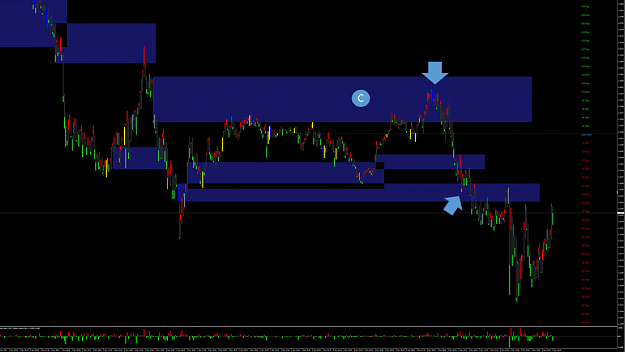
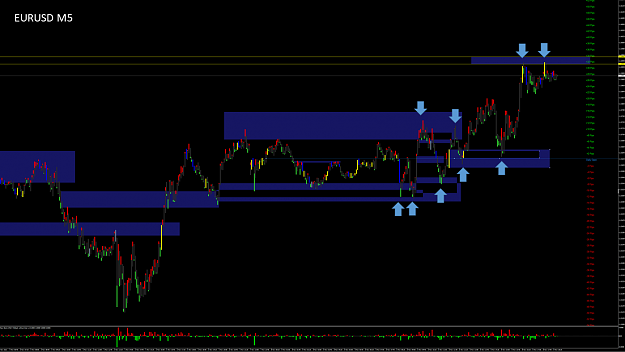
In the M5, this assessment would have been easier and clearer. This is simply due to the fact that the candles are formed randomly based on the time and of course there is a better overview in smaller time units. This can always lead to misinterpretations. The bionic candle is not a Holy Grail, because if it were, the stock market would no longer work in the future. But it can help us to find more entry points, as well as the optimal exit. I would also recommend at the beginning not to make the mistake of focusing exclusively on the Bionic candle. Since you don't know the candle yet, there are many mistakes, which ultimately leads to frustration. Let the bionic candle run in your chart and draw your zones along the way. This will show you, how the Bionic candle works and you will also find further entry points.
I wish you a successful trading day.
Best regards Michael
Forget:That does not work, amateurs build the ark, pros the Titanic!
1