• Home
  • Forums
  • Trades
  • News
  • Calendar
  • Market
  • Brokers
  • Login
  • Join
  • User/Email: Password:
  • 6:56pm
Menu
  • Forums
  • Trades
  • News
  • Calendar
  • Market
  • Brokers
  • Login
  • Join
  • 6:56pm
Sister Sites
  • Metals Mine
  • Energy EXCH
  • Crypto Craft

Options

Bookmark Thread

First Page First Unread Last Page Last Post

Print Thread

Similar Threads

Easy chart navigation and EA overview (req) 0 replies

Jump to date with navigation window issue 2 replies

Simplest and easiest trading strategy 11 replies

Why does GBPUSD enjoy the biggest/easiest price moves? 7 replies

  • Trading Systems
  • /
  • Reply to Thread
  • Subscribe
  • 396
Attachments: Bionic Chart - The easiest forex navigation
Exit Attachments
Tags: Bionic Chart - The easiest forex navigation
Cancel

Bionic Chart - The easiest forex navigation

  • Last Post
  •  
  • 1 1415Page 161718 42
  • 1 15Page 1617 42
  •  
  • Post #301
  • Quote
  • Oct 30, 2021 1:03pm Oct 30, 2021 1:03pm
  •  Bionics
  • Joined Dec 2017 | Status: //houston ǝʍ have a probl | 2,070 Posts
Quoting sleewc
Disliked
{quote} I think you misunderstood my request. As I mentioned in my first post, I am trading other than EUR/USD, and I did spend the whole half day learning and trying to understand the Bionic Candle (even for now, still look at the Bionic Candles formation during weekend); and I did appreciate a lot for this "Gift". I not posting further, as I don't want disrupt further, as you and your team are working on EUR/USD only. Thanks.
Ignored

Hello sleewc, I can absolutely understand that and I believe that we all support your decision. I sincerely wish you continued success in trading and that your goals are met. Greetings Michael
Forget: "That does not work," amateurs build the ark, pros the Titanic!
 
 
  • Post #302
  • Quote
  • Oct 30, 2021 1:04pm Oct 30, 2021 1:04pm
  •  Bionics
  • Joined Dec 2017 | Status: //houston ǝʍ have a probl | 2,070 Posts
Important message to everyone visiting our thread for the first time.

First of all, we are pleased that you would like to take part in this exciting exchange. So that you get the most important basics, please have a look at my first post in the interest of all members:

https://www.forexfactory.com/thread/...rex-navigation

Thank you and we look forward, to a constructive exchange with you. Greetings Michael
Forget: "That does not work," amateurs build the ark, pros the Titanic!
 
 
  • Post #303
  • Quote
  • Edited Oct 31, 2021 12:34pm Oct 30, 2021 5:33pm | Edited Oct 31, 2021 12:34pm
  •  pakeha
  • | Joined Sep 2011 | Status: Member | 414 Posts
Determining Key Candles

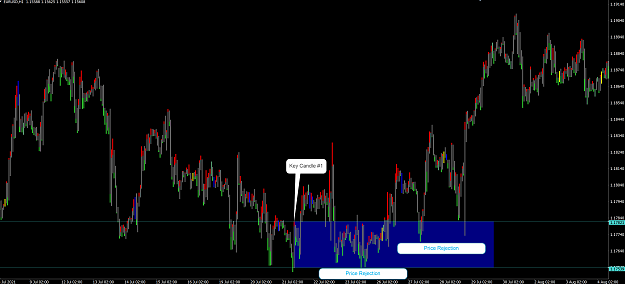
From the first 1:20 of the video on post #286 (Work With Bionic Candle) I have constructed 2 charts on the H1 EURUSD showing how to determine a Key Candle and the associated Key Candle Zones.

Chart 1 attached shows a "strong" candle at a major swing low, and in this case... the confirmation is that the price continued higher. The range of the "strong candle" becomes the Key Candle #1 Blue Zone, which is then projected forward in time. Also noted is a number of price rejections in the Key Candle #1 Blue Zone.
Attached Image (click to enlarge)
Click to Enlarge

Name: Key Candle 1.png
Size: 198 KB


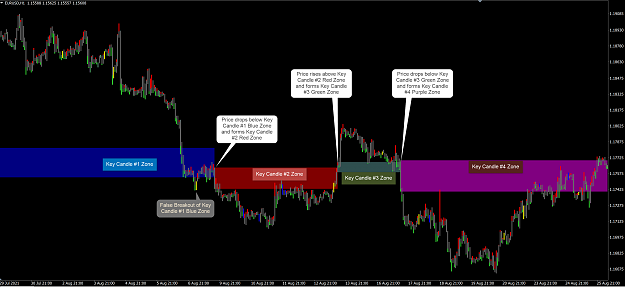
Chart 2 attached shows the continuation of Chart 1 and the Key Candle #1 Blue Zone. This chart also shows the following:
1. A false breakout of the Key Candle #1 Blue Zone. We know it is a false breakout because price did not continue lower (i.e. no confirmation occurred).
2. Price then drops below the Key Candle #1 Blue Zone and continues lower (i.e. confirmation a new Key Candle has been formed). In this case Key Candle #2 forms the Red Zone which is projected forward. Noted are multiple, downward price rejections of the Candle #2 Red Zone.
3. Price then rises above the Key Candle #2 Red Zone and continues higher (i.e. confirmation a new Key Candle has been formed). In this case Key Candle #3 forms the Green Zone which is projected forward. Noted are multiple, upward price rejections of the Candle #3 Green Zone.
4. Price then drops below the Key Candle #3 Green Zone and continues lower (i.e. confirmation a new Key Candle has been formed). In this case Key Candle #4 forms the Purple Zone which is projected forward. Noted are multiple, downward price rejections of the Candle #4 Purple Zone.

..... and onward this analysis goes in time to the current day.

Hope this helps.

Attached Image (click to enlarge)
Click to Enlarge

Name: Key Candle 1_2_3_4 Zones.png
Size: 191 KB
 
6
  • Post #304
  • Quote
  • Oct 30, 2021 7:09pm Oct 30, 2021 7:09pm
  •  pakeha
  • | Joined Sep 2011 | Status: Member | 414 Posts
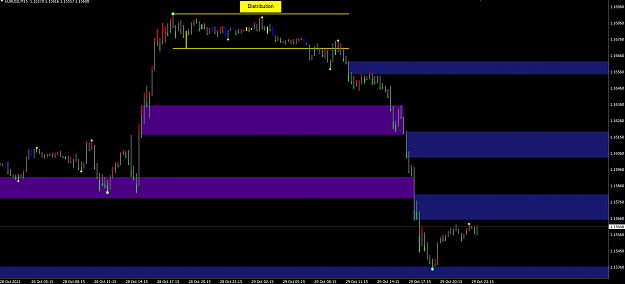
The chart below is my current analysis of the EURUSD.

The Distribution zone (yellow) may also be called rotation, consolidation, range or equilibrium. I happen to prefer the Wyckoff terminology, but that is just me. On the chart the purple zones are broken key candle zones and the blue ones fresh key candle zones. I am showing this on the 15 min TF, but some of the blue zones (especially the bigger candles) were drawn off 5 min candles (i.e. a lower timeframe). I haven't really explored 1 min candles yet.

Comments welcome.
Attached Image (click to enlarge)
Click to Enlarge

Name: EURUSD 29102021.png
Size: 95 KB
 
2
  • Post #305
  • Quote
  • Oct 31, 2021 12:11am Oct 31, 2021 12:11am
  •  Bionics
  • Joined Dec 2017 | Status: //houston ǝʍ have a probl | 2,070 Posts
Quoting pakeha
Disliked
Determining Key Candles From the first 1:20 of the video on post #286 (Work With Bionic Candle) Hope this helps. {image}
Ignored
Hello pakeha,
a great pictorial summary of my video presentation, you have made a lot of effort, thank you very much for that. In the next few weeks it will be a matter of checking these regularities and adding further anomalies. The basis for this is based on invisible price zones that are repeatedly shifted up or down. First of all, I would identify the clear zones, which can also be checked through the price trend in the past, to what extent the price has reacted to the respective "invisible zone". Kind regards Michael
Forget: "That does not work," amateurs build the ark, pros the Titanic!
 
2
  • Post #306
  • Quote
  • Oct 31, 2021 9:52am Oct 31, 2021 9:52am
  •  Bionics
  • Joined Dec 2017 | Status: //houston ǝʍ have a probl | 2,070 Posts
EURUSD on Thursday and Friday


Hello dear Bionic Traders,

As promised, I would like to give you a little insight into what happened in EURUSD on Thursday and Friday from my point of view.

Attached Image (click to enlarge)
Click to Enlarge

Name: Folie1.JPG
Size: 71 KB


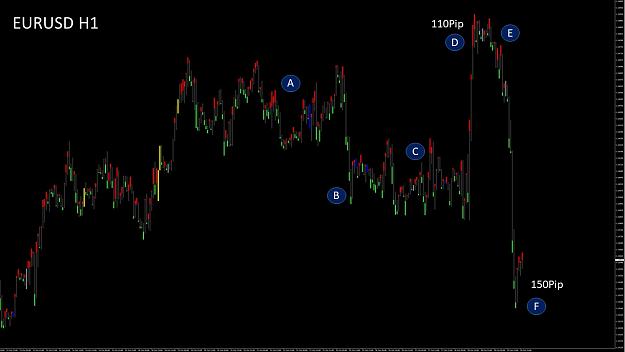
From October 11th to 19th the price was pushed up within a pullback. In the course of October 20th, some big players left their euro position. At point A from October 21st, I noticed that the dollar was massively collected. On October 25th at point B there was a stronger sell-off that brought more short traders into the market. At first there was an equilibrium over three days, where the dollar was initially collected. The fact that short traders continued to place themselves could be seen on October 27th as the big players started to buy the euro. Then the price was pushed up on October 28th by the short trader stops. The short traders whose stops were above point A and C were removed. At the high, the euro positions were closed and the price pushed down. Since a lot of longs were placed on the high, the stops caused a massive 150 pips drawdown.

Attached Image (click to enlarge)
Click to Enlarge

Name: Folie2.JPG
Size: 90 KB


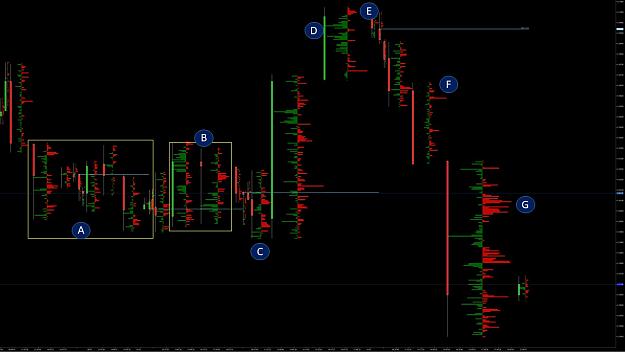
At Point A, we first see partial sales from the dollar and another collection campaign within the dollar. At Point B, the euro is collected more strongly. Then there was a small fake outbreak at Point C and the price was driven up. Shortly before the high, limit buy orders intercepted the downward price. The reason for this was to bring more long traders into the market. At Point E, the big players could only get out of their Euro position that they had previously collected at Point B. There was no time to buy a dollar here. The price was initially pushed down to Point F and there the dollar was collected again. You can also see again at Point G that the dollar was being collected here. Overall, that spoke in favor of another sale.

Attached Image (click to enlarge)
Click to Enlarge

Name: Folie3.JPG
Size: 97 KB


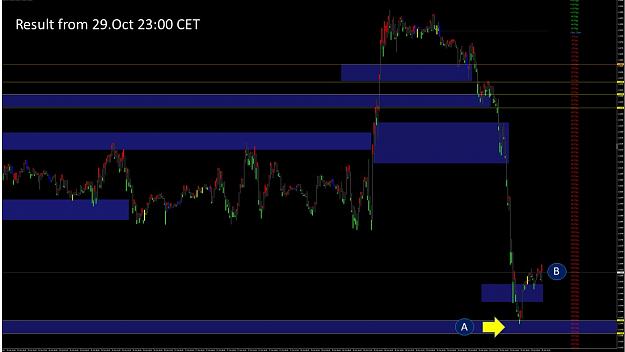
When I made this prediction at 12:11 p.m. on October 29, the background was as follows.

Attached Image (click to enlarge)
Click to Enlarge

Name: Folie4.JPG
Size: 77 KB


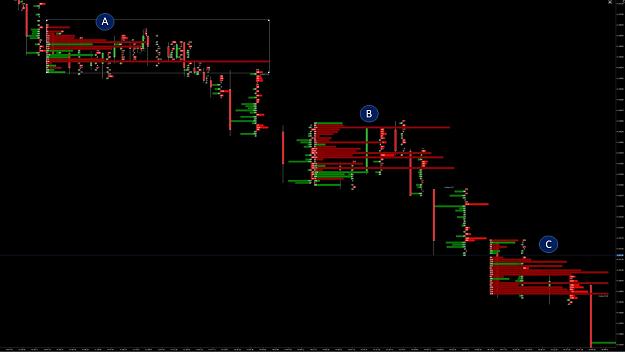
As early as 10:00 in the morning (Point A), the big players began with a massive purchase of the dollar. It continued at 3:00 p.m. and 4:00 p.m.

Attached Image (click to enlarge)
Click to Enlarge

Name: Folie5.JPG
Size: 114 KB


In fact, as expected, the price fell more sharply. The resistance zones we drew in earlier all worked perfectly. At 6:30 p.m., I finished my trade and posted one last chart where I had drawn another resistance zone at point B.

Attached Image (click to enlarge)
Click to Enlarge

Name: Folie6.JPG
Size: 99 KB


The price ran exactly into this zone, only to then run up 30 pip again. As we know, these strong price movements are relatively rare and this is precisely why I am concentrating more on smaller movements with the key candles.

Attached Image (click to enlarge)
Click to Enlarge

Name: Folie7.JPG
Size: 89 KB


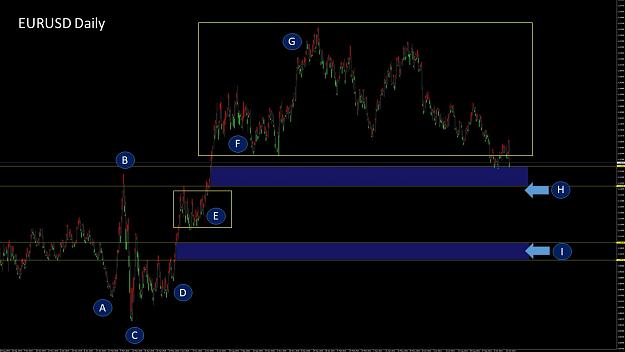
Here we see a daily chart in EURUSD. I am always very careful with long-term forecasts, as things can change in the relatively short term.

At the beginning of the corona pandemic, in February 2020 at Point A, there was a large gap of 188 pip that the big players really intended to close, as the dollar had previously been massively bought. Unfortunately, retailers were also convinced that this gap would now be closed. Within 2 days, the big players got out of their dollar position and took a long position. After that, the price was pushed up by 700 pip to Point B. Everyone was surprised that the gap was not closed. This gap closure (Point C) was then made up for immediately. At Point D there was a stronger euro purchase and the price was pushed up to Point E. Here too, as with Point F, the euro continued to be collected. Point G shows you a typical view when the big players get out of their euro position. After that, the price went down again. From my point of view, there are now two options for the price to keep rising in the long term. The price goes up to Point H, so the long traders, from the equilibrium of Point F, also removed,. The price trend at Point E looks as if most of the long traders have been eliminated, but of course I cannot say how many long traders are still there. In order to get these long traders out completely, the price would have to run into zone I. After that, the upward movement could continue. But that's pure speculation. It is important to look at the smaller time zones in the Bionic candle. So that very good predictions can be made, which will significantly increase your profit rate.

I wish you a nice Weekend

Kind regards Michael
Forget: "That does not work," amateurs build the ark, pros the Titanic!
 
2
  • Post #307
  • Quote
  • Oct 31, 2021 1:19pm Oct 31, 2021 1:19pm
  •  pakeha
  • | Joined Sep 2011 | Status: Member | 414 Posts
Michael

Can you explain this chart setup please.

What type of candles? What timeframe? What indicator?

Thanks

https://www.forexfactory.com/attachm...1&d=1635688287
 
1
  • Post #308
  • Quote
  • Oct 31, 2021 1:51pm Oct 31, 2021 1:51pm
  •  ingo3344
  • | Joined Jan 2020 | Status: Member | 373 Posts
Thank you Michael , your remarks are as always super
 
1
  • Post #309
  • Quote
  • Oct 31, 2021 2:45pm Oct 31, 2021 2:45pm
  •  Xperience
  • | Joined Sep 2018 | Status: Member | 64 Posts
Hello Michael,

I'm following your Equilibrium thread quite long even most of the material you've posted is to advanced for my tiny brain.
But at least I get the bigger insight you want to convey to help other retail trader like me.
And yes, the bionic candle is a big arsenal you've given to identify sudden price direction in low time frame as I presume your intention as scalper.
I really appreciate your generousity to what you've done and share so far.

I can see and learn that you always hold your position within very short time to gain security and less exposure to loss.
In that spirit, isn't it better to discuss to identify the most possible chance of direction within low time frame, say M1 or M15?
IMHO, for most scalper, high time frame is not have big relevance with scalping as we, or you only take few pips per trade within few seconds or minutes.
As per your advise to see the action of bionic candle within very low time frame, 1 second or 5 tick for example - I can see very clear when (my assumption) big player come in to play.

Just my 2 cents.
- X -
 
1
  • Post #310
  • Quote
  • Nov 1, 2021 2:42am Nov 1, 2021 2:42am
  •  Bionics
  • Joined Dec 2017 | Status: //houston ǝʍ have a probl | 2,070 Posts
Quoting pakeha
Disliked
Michael Can you explain this chart setup please. What type of candles? What timeframe? What indicator? Thanks {image}
Ignored
Hello pakeha, this is not an indicator, but real stock exchange data that has been transferred from a non-time-based view to an H4. This type of representation does not exist because I programmed it myself. I only used the diagram to explain roughly how the big players' collecting campaigns work. Greetings Michael
Forget: "That does not work," amateurs build the ark, pros the Titanic!
 
 
  • Post #311
  • Quote
  • Nov 1, 2021 2:43am Nov 1, 2021 2:43am
  •  Bionics
  • Joined Dec 2017 | Status: //houston ǝʍ have a probl | 2,070 Posts
Important message to everyone visiting our thread for the first time.

First of all, we are pleased that you would like to take part in this exciting exchange. So that you get the most important basics, please have a look at my first post in the interest of all members:

https://www.forexfactory.com/thread/...rex-navigation

Thank you and we look forward, to a constructive exchange with you. Greetings Michael
Forget: "That does not work," amateurs build the ark, pros the Titanic!
 
 
  • Post #312
  • Quote
  • Nov 1, 2021 2:43am Nov 1, 2021 2:43am
  •  Bionics
  • Joined Dec 2017 | Status: //houston ǝʍ have a probl | 2,070 Posts
Quoting ingo3344
Disliked
Thank you Michael , your remarks are as always super
Ignored
Hello Ingo, I would be happy if this information helps you to work with the Bionic Candle in the long term. However, this will take a certain amount of time before you can derive concrete benefits from it. The reason for this lies in the structure of this candle, which tends to pursue the institutional approach, as the invisible price zones are identified, where the decisive stops for retailers are. Kind regards Michael
Forget: "That does not work," amateurs build the ark, pros the Titanic!
 
 
  • Post #313
  • Quote
  • Nov 1, 2021 2:43am Nov 1, 2021 2:43am
  •  Bionics
  • Joined Dec 2017 | Status: //houston ǝʍ have a probl | 2,070 Posts
Quoting Xperience
Disliked
Hello Michael, I'm following your Equilibrium thread quite long even most of the material you've posted is to advanced for my tiny brain. But at least I get the bigger insight you want to convey to help other retail trader like me. And yes, the bionic candle is a big arsenal you've given to identify sudden price direction in low time frame as I presume your intention as scalper. I really appreciate your generousity to what you've done and share so far. I can see and learn that you always hold your position within very short time to gain security...
Ignored

Hello Xperience,

thank you very much for your kind words. The fact that there are many things that you cannot understand is not due to the fact that your brain is too tiny or a lack of intelligence, but rather because people's Way of thinking are always different. Whereby I always emphasize that my method is only about my personal opinion and that I do not claim to be right. I may even be completely wrong, but I will not change my approach because I am successful with it.

Of course, I act in a very short time frame, but the larger time frames are also important to me. I would like to give you an example of this. If you drive a vehicle very fast at night and only have the low beam on, you will not see a dangerous curve until later than if you switched on the high beam. The big players are not on the move in short timeframes, as they sometimes carry out their collection campaigns over many hours. Imagine that you already know roughly how the price will go on a day. Then you can act much better in a short timeframe because you see the big picture.

The Bionic Candle was created precisely because we can reduce the invisible price zones from the larger time units to a smaller time frame. A larger unit of time shows more and more accurate data as it eliminates the noise of the market. You should always use this advantage. We will talk in great detail about how these zones are made smaller and how to work successfully even on a tickchart.

Since an H1 or M15 always provides more precise information than an M1, the easiest way to get to know the advantages of the Bionic Candle is in a higher time unit. The smaller the time unit, the more difficult it is to make concrete statements. No matter what you learn, you always start with the simplest things in order to understand a thing. Then the level of difficulty can be increased. First use the larger time frame e.g. M15 to understand the principle. If you are a professional there, you can increase your level of difficulty at any time. In our thread there are many traders who are just getting to know the Bionic Candle. Some who have known my blog: “Equilibrium, the key to success” for years, are much further with the Bionic Candle. For some traders this thread is too slow, for others who are new to it too fast. We also know that from our school days. I'm trying to strike a middle ground here to help both groups of traders. In addition, we want to work together here to discover further advantages of the Bionic Candle. For this we need a homogeneous level of knowledge and we have to achieve this together first. Unfortunately, that takes time.

Kind regards Michael
Forget: "That does not work," amateurs build the ark, pros the Titanic!
 
 
  • Post #314
  • Quote
  • Nov 1, 2021 4:46am Nov 1, 2021 4:46am
  •  ingo3344
  • | Joined Jan 2020 | Status: Member | 373 Posts
Hello, now the exact entry is still missing
Attached Image(s) (click to enlarge)
Click to Enlarge

Name: Unbenannt.PNG
Size: 25 KB
Click to Enlarge

Name: Unbenannt1.PNG
Size: 35 KB
 
 
  • Post #315
  • Quote
  • Nov 1, 2021 4:51am Nov 1, 2021 4:51am
  •  Bionics
  • Joined Dec 2017 | Status: //houston ǝʍ have a probl | 2,070 Posts
Bionic Candle MT4, MT5, Tradingview


Hello dear Bionic Traders,


Since I am repeatedly asked whether the Bionic Candle will also be available for Tradingview or the MT5, I have decided to deal with this topic in detail. Since it directly affects the Bionic Candle, this is important to me. However, I have put the post on my thread: Equilibrium, the key to success, because I want to use this thread here primarily for the big player strategies in combination with the Bionic Candle. If you work with the MT4 and that will be more than 85% of all traders, this post is not relevant. The remaining 15% are welcome, to use the link below.

https://www.forexfactory.com/thread/...5#post13767865

I would also like to ask each of you not to use this post as a future basis for discussion in this thread, as this will only trigger unnecessary discussions. Since it was basically about the Bionic candle, I only commented on it and gave my opinion. We will continue to deal with the Bionic Candle in this thread, as it brings the greatest benefit to the traders present here.

Greetings Michael
Forget: "That does not work," amateurs build the ark, pros the Titanic!
 
 
  • Post #316
  • Quote
  • Nov 1, 2021 5:00am Nov 1, 2021 5:00am
  •  Bionics
  • Joined Dec 2017 | Status: //houston ǝʍ have a probl | 2,070 Posts
Quoting ingo3344
Disliked
Hello, now the exact entry is still missing {image} {image}
Ignored

Attached Image (click to enlarge)
Click to Enlarge

Name: Bild1.png
Size: 191 KB


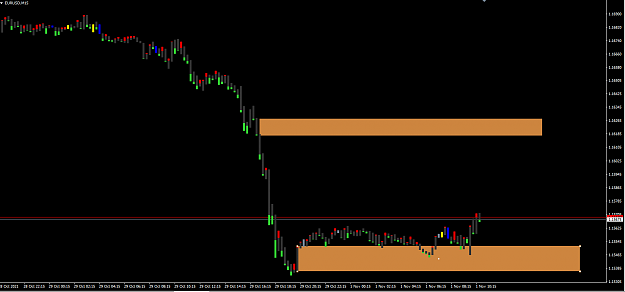
Hello Ingo, there is a larger zone in the M15, but I don't know yet whether it will hold. Greetings Michael
Forget: "That does not work," amateurs build the ark, pros the Titanic!
 
 
  • Post #317
  • Quote
  • Nov 1, 2021 7:55am Nov 1, 2021 7:55am
  •  Bionics
  • Joined Dec 2017 | Status: //houston ǝʍ have a probl | 2,070 Posts
Quoting ingo3344
Disliked
Hello, now the exact entry is still missing {image} {image}
Ignored

Hello Ingo, a quick update again.

Attached Image (click to enlarge)
Click to Enlarge

Name: Folie1.PNG
Size: 96 KB


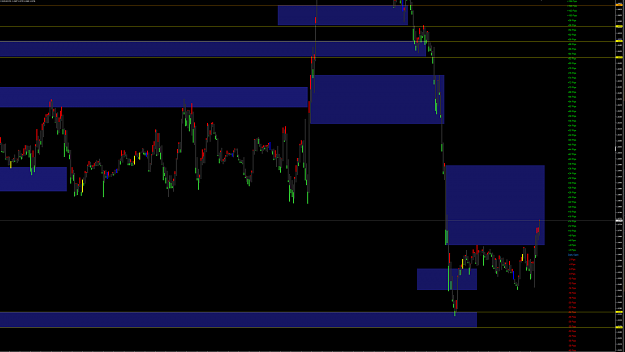
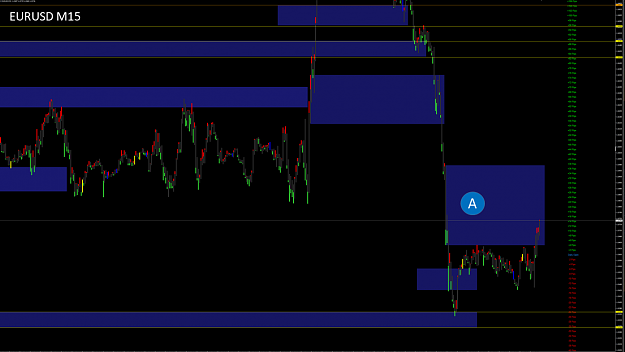
The zone at point A is of course relatively large in the M15.

Attached Image (click to enlarge)
Click to Enlarge

Name: Folie2.PNG
Size: 102 KB


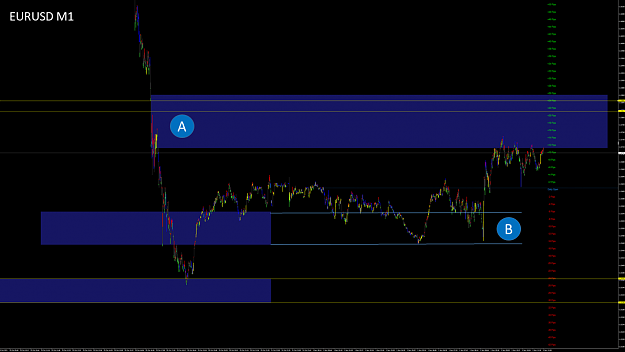
Now I have made it a little smaller in M1 (Point A), but the zone with 14 pip would still be too big for me. The extension of zone B, which I marked on Friday, would even have worked.

Attached Image (click to enlarge)
Click to Enlarge

Name: Folie3.PNG
Size: 107 KB


In the M1, I have now gone back a bit in the past and tried to mark the two strongest zones in black. The first zone worked, we'll see if the second zone works. I usually work with a tick chart in this area, but on Friday I worked without tick chat, so I cannot access these zones. I hope this helps you further.

Kind regards Michael
Forget: "That does not work," amateurs build the ark, pros the Titanic!
 
3
  • Post #318
  • Quote
  • Nov 1, 2021 8:57am Nov 1, 2021 8:57am
  •  Bionics
  • Joined Dec 2017 | Status: //houston ǝʍ have a probl | 2,070 Posts
Template for the Bionic Candle


Hello dear Bionic Traders,


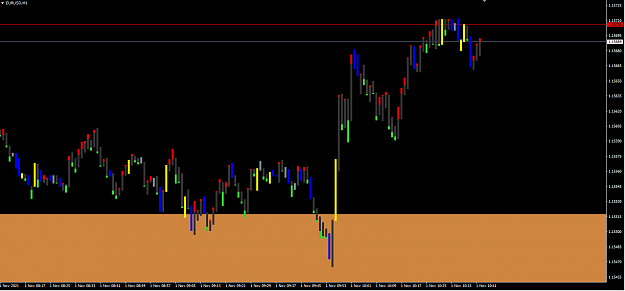
As promised, you will receive the first template for the Bionic Candle today. In addition to the Bionic Candle, I have added two more auxiliary indicators that I will now explain in more detail.

Attached Image (click to enlarge)
Click to Enlarge

Name: Folie1.PNG
Size: 95 KB


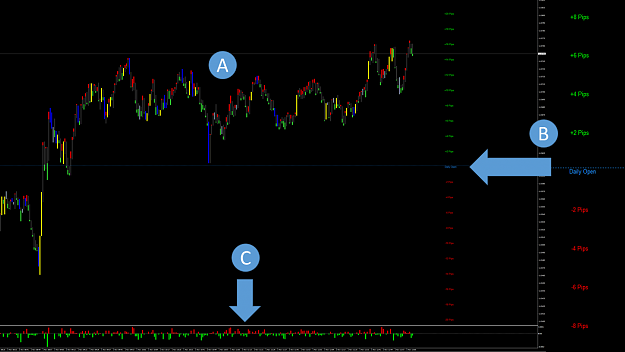
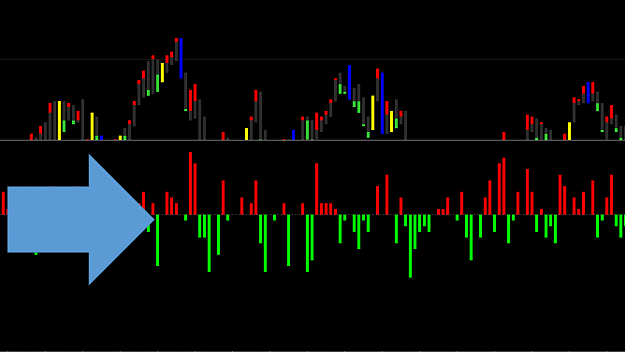
First you will find the Bionic Indicator (Point A) again, which uses the template to automatically adjust the colors of the Bionic Candle. The auxiliary indicator at Point B shows you where you are currently in the market. It was developed by a very creative programmer and trader CJA and gives you an excellent overview of where you are currently in the market. Of course, the indicator can do a lot more. The auxiliary indicator at Point C was developed by me, just like the Bionic Candle. This indicator basically only shows the size of the respective pullbacks in each candle. Why is that important?

Attached Image (click to enlarge)
Click to Enlarge

Name: Folie2.PNG
Size: 55 KB

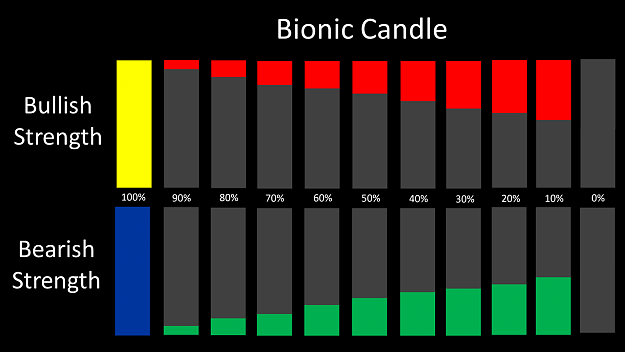
Perhaps you still remember that the smaller a pullback in the Bionics candle, the greater the respective candle strength. Depending on how small the bionic candles are on your chart, you may not be able to distinguish the sizes of certain pullbacks immediately.

Attached Image (click to enlarge)
Click to Enlarge

Name: Folie3.PNG
Size: 53 KB

At Point A you can see three candles, with their respective pullbacks. In this enlarged view, of course, it is easy to find out that these pullbacks are the same size. In the chart, the bionic candle is often smaller and then it is often difficult to differentiate between the pullbacks. Simply pull this indicator up and you can see which pullback is larger or smaller. At point B you can now see that the pullbacks are the same size.

Simply pack the three indicators supplied in the “Indicators” folder and the Bionics template number 1 in your “Templates” subfolder. Then this template calls up and everything should work.

I wish you continued success.

Best regards Michael

Attached File(s)
File Type: zip Bionic Template.zip   121 KB | 661 downloads
Forget: "That does not work," amateurs build the ark, pros the Titanic!
 
10
  • Post #319
  • Quote
  • Nov 2, 2021 6:49am Nov 2, 2021 6:49am
  •  Bionics
  • Joined Dec 2017 | Status: //houston ǝʍ have a probl | 2,070 Posts
New update


Hello dear Bionic Traders,

I consider it very positive that this blog has been quiet at the moment, as many of you are now dealing with the Bionic Candle, drawing in zones and training. Here is a little update about the last few days.

Attached Image (click to enlarge)
Click to Enlarge

Name: Folie1.PNG
Size: 96 KB

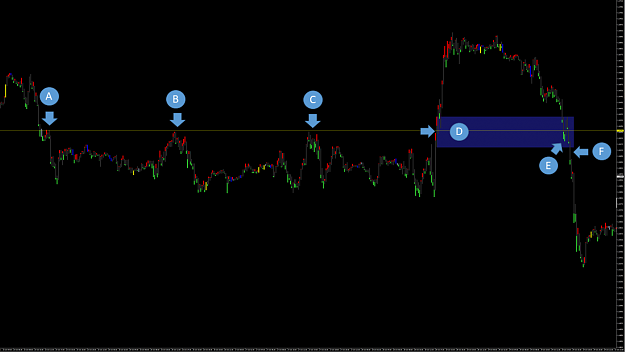
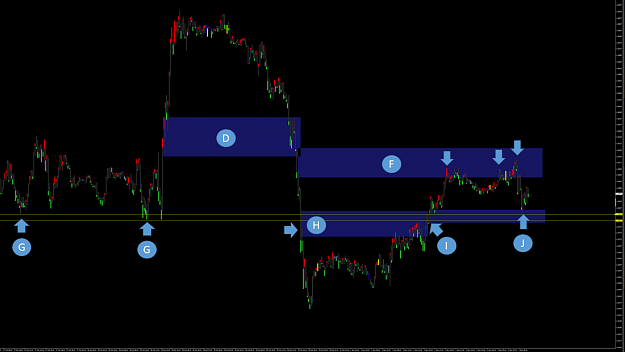
From October 25th to 27th we see how the price at points A, B and C is repeatedly rejected. This resulted in the key candle at Point D on October 28th. We have already drawn this zone in my last posts. On October 29th, the price at Point E reacted briefly and then broke the zone. This resulted in a new key candle at Point F.

Attached Image (click to enlarge)
Click to Enlarge

Name: Folie2.PNG
Size: 106 KB

This new zone turned the price down a few times on November 1st and 2nd. At Point G we see how the price has been turned up again and again. I made the key candle at Point H smaller in the M1. The price has reacted twice and has broken through Zone H at Point I. This resulted in a new key zone (Point J) which responded accordingly on November 2nd at 10:00 a.m.

Attached Image (click to enlarge)
Click to Enlarge

Name: Folie3.PNG
Size: 43 KB

Yesterday I made a new template available to you, where I posted another help indicator. In principle, this indicator only shows the decisive pullbacks in the Bionic candle. Of course, you can get further, very interesting information from this indicator, which I will make available to you in the form of a video. I'll see if I can upload this important information by tomorrow.

PS: Exactly above zone F there is another key zone that could deflect the price more sharply downwards.

I wish you continued success with the Bionic candle.

Kind regards Michael
Forget: "That does not work," amateurs build the ark, pros the Titanic!
 
3
  • Post #320
  • Quote
  • Nov 2, 2021 7:02am Nov 2, 2021 7:02am
  •  Bionics
  • Joined Dec 2017 | Status: //houston ǝʍ have a probl | 2,070 Posts
Important message to everyone visiting our thread for the first time.

First of all, we are pleased that you would like to take part in this exciting exchange. So that you get the most important basics, please have a look at my first post in the interest of all members:

https://www.forexfactory.com/thread/...rex-navigation

Thank you and we look forward, to a constructive exchange with you. Greetings Michael
Forget: "That does not work," amateurs build the ark, pros the Titanic!
 
 
  • Trading Systems
  • /
  • Bionic Chart - The easiest forex navigation
  • Reply to Thread
    • 1 1415Page 161718 42
    • 1 15Page 1617 42
0 traders viewing now
  • More
Top of Page
  • Facebook
  • Twitter
About FF
  • Mission
  • Products
  • User Guide
  • Media Kit
  • Blog
  • Contact
FF Products
  • Forums
  • Trades
  • Calendar
  • News
  • Market
  • Brokers
  • Trade Explorer
FF Website
  • Homepage
  • Search
  • Members
  • Report a Bug
Follow FF
  • Facebook
  • Twitter

FF Sister Sites:

  • Metals Mine
  • Energy EXCH
  • Crypto Craft

Forex Factory® is a brand of Fair Economy, Inc.

Terms of Service / ©2023