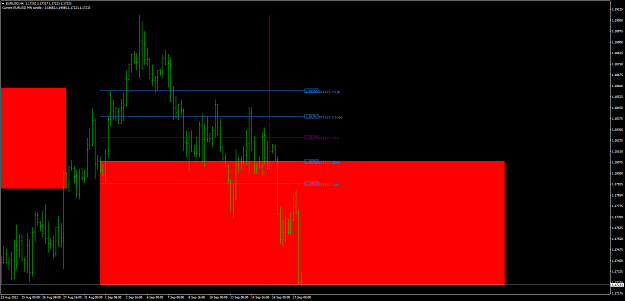
Disliked{quote} On the first day of each month draw a horizontal line from the daily high and low extended to the right. What jmn6511 is saying that within that month, price will break through either the high or low 100% of the time. Now in terms of strategy, I'm not too sure if jmn6511 was implying this but what I took from it is that the high and low of the first day serve as target areas for interday trades. Say price still hasn't broke out of the daily high or low from the first day, it's a fair assumption that price eventually will, so the idea is...Ignored
Disliked{quote} Can you provide a few examples of what you are talking about?Ignored
Attached Image (click to enlarge)

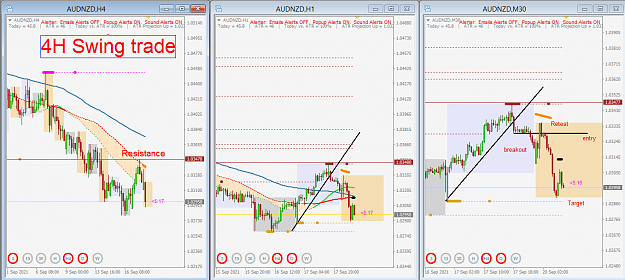
There are trades on that chart almost every day.
Even better is the H4. All from five lines drawn after the first day of the month.
Attached Image (click to enlarge)
If you are good at something, never do it for free--Joker