Hello dear Bionic Traders,
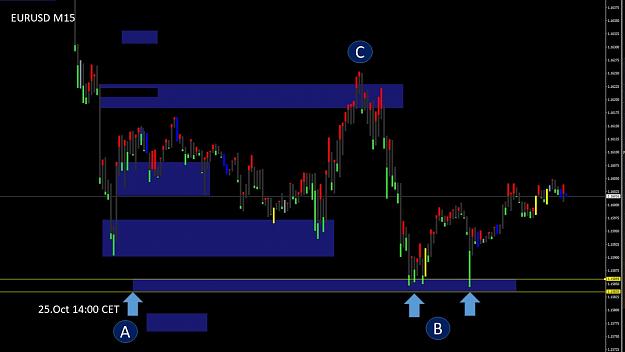
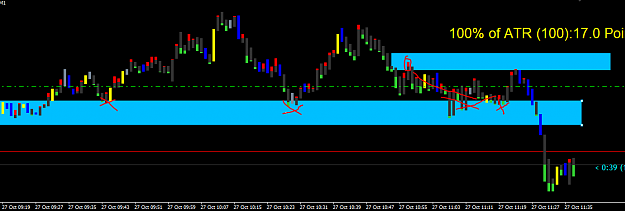
In my post 220 I have drawn different zones in the EURUSD M1 that could be relevant in the future. The zone that I marked on October 25th at 2:00 p.m. (Point A) was entered for the first time yesterday afternoon (Point B). Overall, the hit rate has been quite good so far, except for the zone at Point C. As promised, I'll show you why I was wrong there.
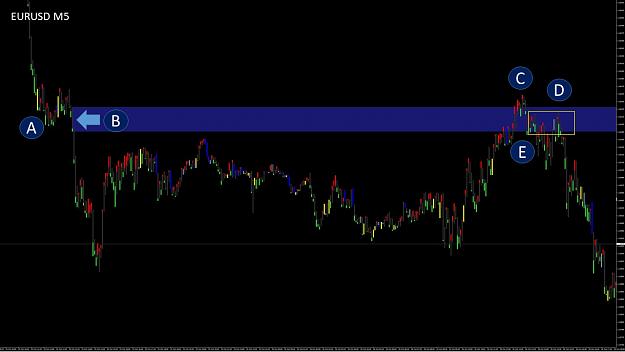
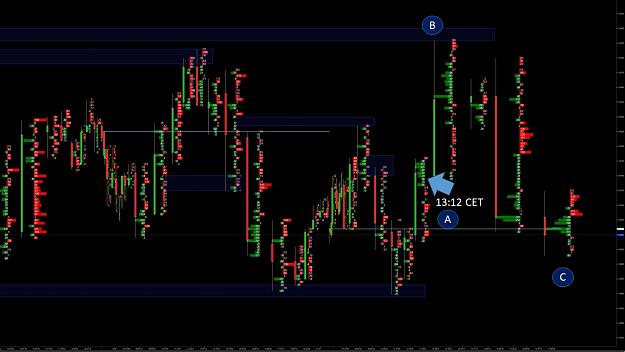
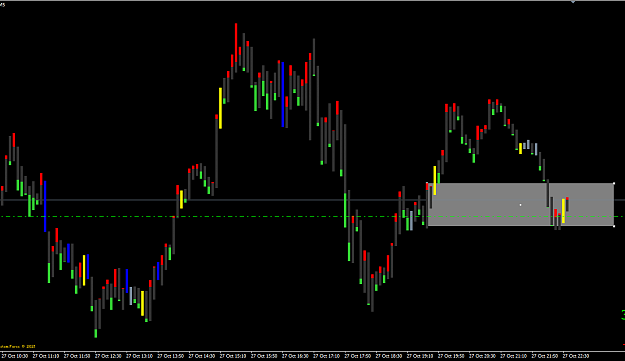
In the M5 at point A we see an equilibrium that is broken by the candle at point B. That's why that was my key candle. However, the price went a little higher at Point C. The fact that the zone worked at Point D was a coincidence and actually has to do with the key candle at Point E.
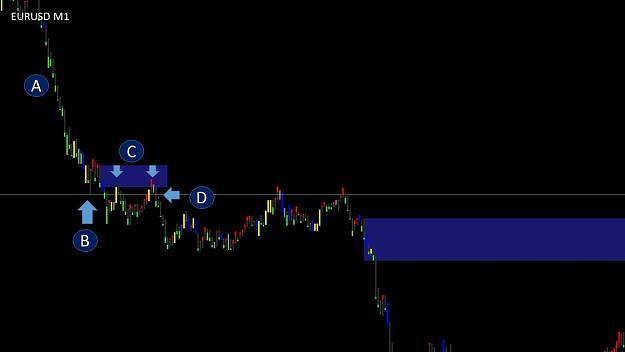
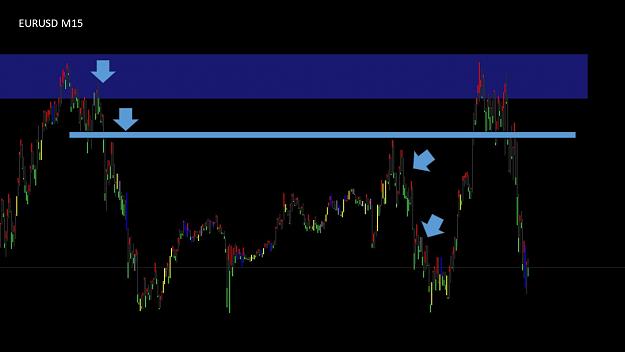
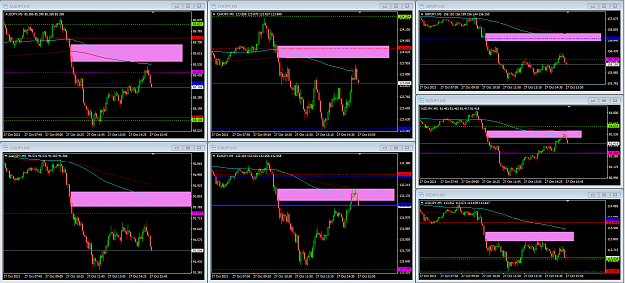
My mistake was, that I didn't watch the movement, in the M1. First of all, we see that the price is falling sharply (Point A). At point B, the price was pushed up more strongly for the first time. I would normally have drawn a line there. The key candle at Point C also rejected the price twice. At Point D we see a candle that ensures that the price initially goes down a bit and at the same time breaks my line.
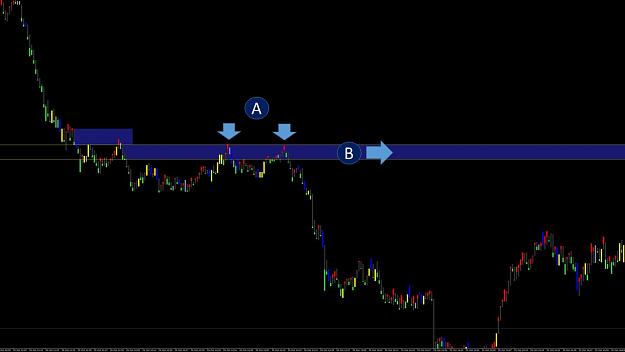
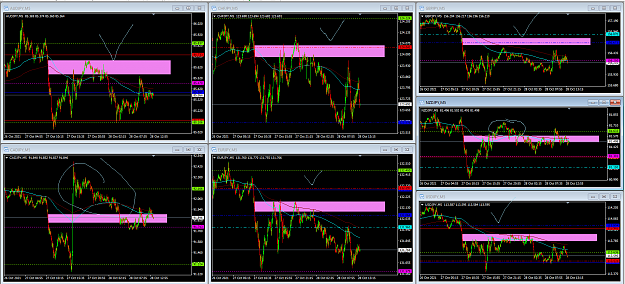
If you now draw in this candle, you can see that at point A the price reacts accordingly. I would now see this zone as a resistance zone in the future.
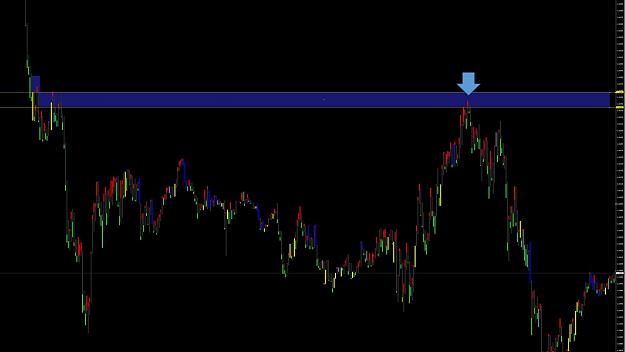
Here we can see that this key candle would have been correct.
The Bionic Candle is a support to find more entries in the future. Of course you won't draw every zone correctly, because I also make some mistakes. The key factor is finding more correct zones that work. With good money management, you can significantly increase your probability of winning. First of all, I recommend each participant in our project to find these key candles in the past and then see how the price reacted to them. This means that the learning effect is higher than if you used the Bionic Candle immediately for trading.
I wish you all the best in retail today, best regards Michael
Attached Image (click to enlarge)
In my post 220 I have drawn different zones in the EURUSD M1 that could be relevant in the future. The zone that I marked on October 25th at 2:00 p.m. (Point A) was entered for the first time yesterday afternoon (Point B). Overall, the hit rate has been quite good so far, except for the zone at Point C. As promised, I'll show you why I was wrong there.
Attached Image (click to enlarge)
In the M5 at point A we see an equilibrium that is broken by the candle at point B. That's why that was my key candle. However, the price went a little higher at Point C. The fact that the zone worked at Point D was a coincidence and actually has to do with the key candle at Point E.
Attached Image (click to enlarge)
My mistake was, that I didn't watch the movement, in the M1. First of all, we see that the price is falling sharply (Point A). At point B, the price was pushed up more strongly for the first time. I would normally have drawn a line there. The key candle at Point C also rejected the price twice. At Point D we see a candle that ensures that the price initially goes down a bit and at the same time breaks my line.
Attached Image (click to enlarge)
If you now draw in this candle, you can see that at point A the price reacts accordingly. I would now see this zone as a resistance zone in the future.
Attached Image (click to enlarge)
Here we can see that this key candle would have been correct.
The Bionic Candle is a support to find more entries in the future. Of course you won't draw every zone correctly, because I also make some mistakes. The key factor is finding more correct zones that work. With good money management, you can significantly increase your probability of winning. First of all, I recommend each participant in our project to find these key candles in the past and then see how the price reacted to them. This means that the learning effect is higher than if you used the Bionic Candle immediately for trading.
I wish you all the best in retail today, best regards Michael
Forget:That does not work, amateurs build the ark, pros the Titanic!
1