GBPUSD Weekly Technical Outlook
GBPUSD market operation is in a falling wedge (blue). On the weekly time frame, two weeks ago, market operation threatened the 1.35300 horizontal support (light green) by surging below it but failed to close below. Last week, bulls offered a strong challenge to any further bearish control, resulting in the printing of a bullish candlestick that closed about 60 pips above the 1.35300 horizontal support (light green). This really is not a strong bullish effort and bears are still more influential in the market than bulls. Apparently, bulls are attempting a retest of the 1.37470/1.39000 weekly supply zone (red), which is nestled within a monthly supply zone.

A bullish failure would incentivize bears to pursue a southward rotation. The 1.34120/1.31300 area (green) is a major horizontal support zone.
GBPUSD price action on the daily time frame is operating within a falling wedge (blue). On September 29, price action broke below the 1.35300 horizontal support (light green) and the wedge support trendline. However, it was rather brief, as bulls effected a northward pullback into within the falling wedge (blue). Presently, price action is sideways, but bulls are still in contention. We may see a further northward move, perhaps for liquidity grab, before a southward continuation as the technical impulse on the weekly time frame favours bears more than bulls. The 1.37470/1.39000 weekly supply zone (red) is still intact.

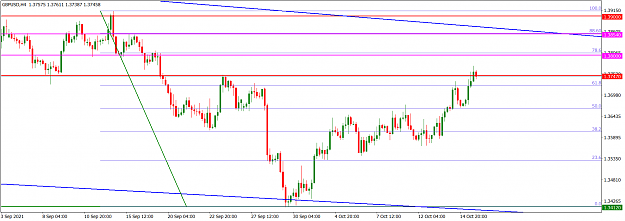
On the H4 time frame, on Monday and Tuesday last week, GBPUSD price action made a 78.6 Fib retracement of a downward swing from 1.37165 to 1.341000, apparently to retest the H4 supply around 1.37000 but failed. It created another supply area around 1.36200 on Wednesday, which it retested on Thursday and Friday yielding a bearish rejection. Presently, it is in a bearish mode around the 61.8 Fib zone and may result in a southward turnaround should there be a bearish follow-through in the early part of this week, particularly with a significant breakdown of the 1.35300 horizontal supply zone (light green) seen on the weekly time frame. The technical impulse and order flow context favour bears more than bulls, so any bullish move in the early part of this week would be corrective in nature.

I may be wrong. Trade safe and prosper.
KP
GBPUSD market operation is in a falling wedge (blue). On the weekly time frame, two weeks ago, market operation threatened the 1.35300 horizontal support (light green) by surging below it but failed to close below. Last week, bulls offered a strong challenge to any further bearish control, resulting in the printing of a bullish candlestick that closed about 60 pips above the 1.35300 horizontal support (light green). This really is not a strong bullish effort and bears are still more influential in the market than bulls. Apparently, bulls are attempting a retest of the 1.37470/1.39000 weekly supply zone (red), which is nestled within a monthly supply zone.
Attached Image (click to enlarge)
A bullish failure would incentivize bears to pursue a southward rotation. The 1.34120/1.31300 area (green) is a major horizontal support zone.
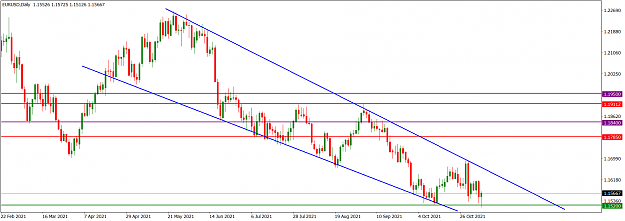
GBPUSD price action on the daily time frame is operating within a falling wedge (blue). On September 29, price action broke below the 1.35300 horizontal support (light green) and the wedge support trendline. However, it was rather brief, as bulls effected a northward pullback into within the falling wedge (blue). Presently, price action is sideways, but bulls are still in contention. We may see a further northward move, perhaps for liquidity grab, before a southward continuation as the technical impulse on the weekly time frame favours bears more than bulls. The 1.37470/1.39000 weekly supply zone (red) is still intact.
Attached Image (click to enlarge)
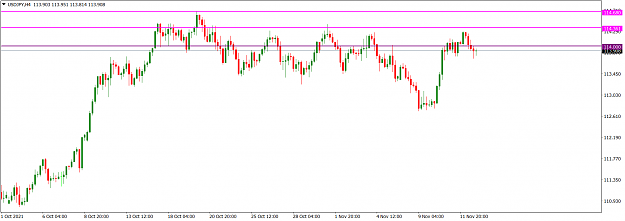
On the H4 time frame, on Monday and Tuesday last week, GBPUSD price action made a 78.6 Fib retracement of a downward swing from 1.37165 to 1.341000, apparently to retest the H4 supply around 1.37000 but failed. It created another supply area around 1.36200 on Wednesday, which it retested on Thursday and Friday yielding a bearish rejection. Presently, it is in a bearish mode around the 61.8 Fib zone and may result in a southward turnaround should there be a bearish follow-through in the early part of this week, particularly with a significant breakdown of the 1.35300 horizontal supply zone (light green) seen on the weekly time frame. The technical impulse and order flow context favour bears more than bulls, so any bullish move in the early part of this week would be corrective in nature.
Attached Image (click to enlarge)
I may be wrong. Trade safe and prosper.
KP
Do your homework, follow the footprints of smart money