EURUSD Weekly Technical Outlook
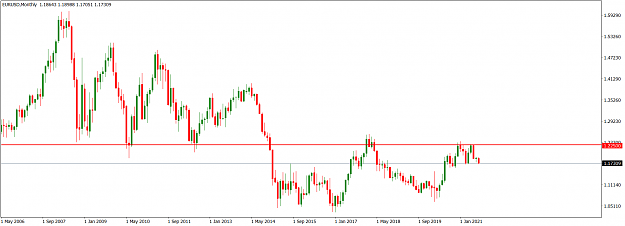
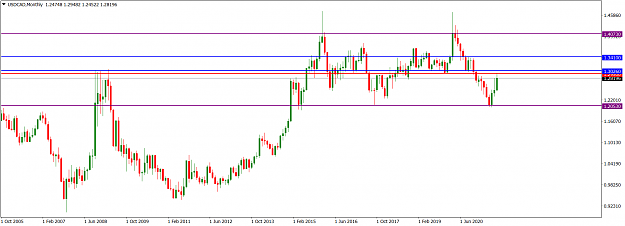
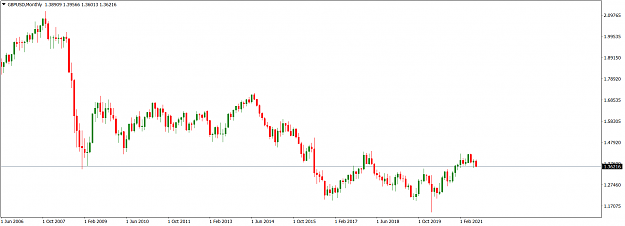
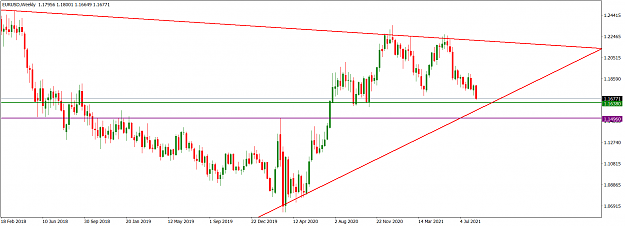
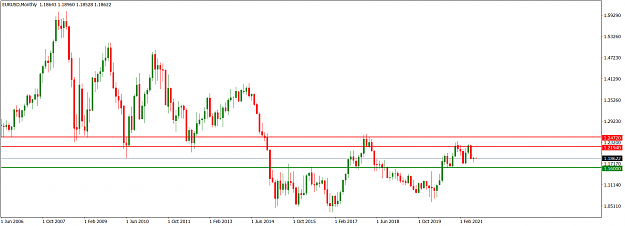
In December 2020, EURUSD market operation rejected the 1.21940/1.24720 supply zone (red), and multi-year horizontal resistance, on the monthly time frame, but there was a retest of the zone in May 2021 before a southward turnaround. Technically, the EURUSD is under a bearish pressure, although on the monthly timeframe market operation was sideways in July. Further bearish drive will likely see the completion of an ‘M’ pattern around the 1.16000 handle (green).
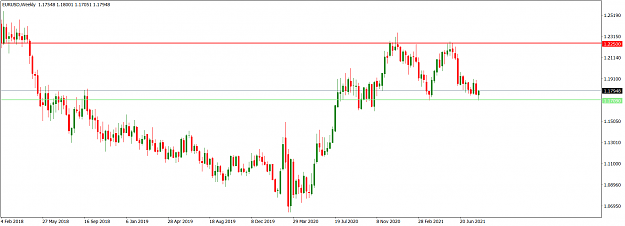
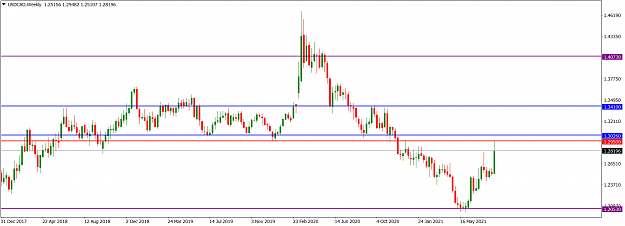
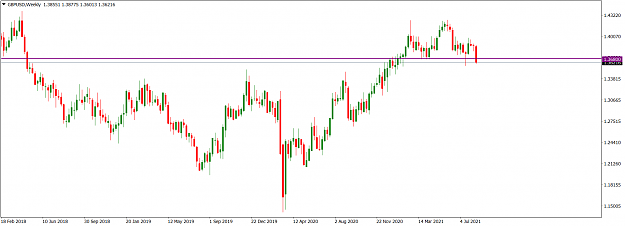
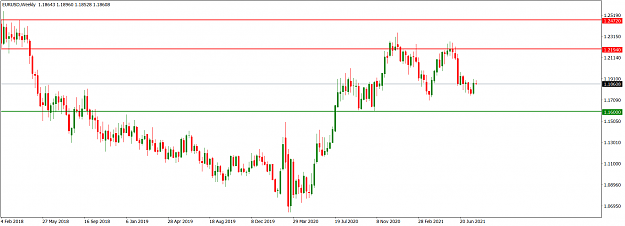
On the weekly time frame, the printing of top-wicked candlesticks over several weeks at the 1.21940/1.24720 supply zone (red), and a multi-year horizontal resistance, seen on the monthly time frame technically favours bears. Recent order flow context, particularly with the bearish swing that began eight weeks ago, shows the intention of bears to maintain market influence. Furthermore, the fact that last week’s market operation printed an indecision candlestick as opposed to the bullish retracing print of two weeks ago indicates a weakening of bullish pressure. Thus, on the weekly time frame, the technicals give an edge to bears.
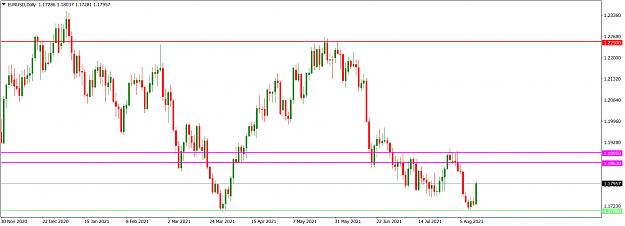
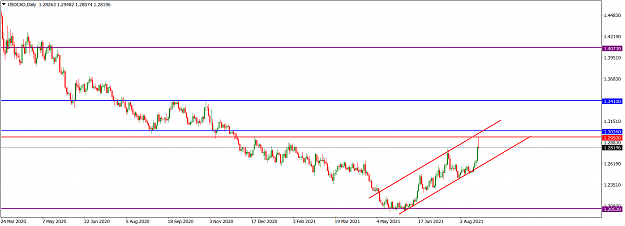
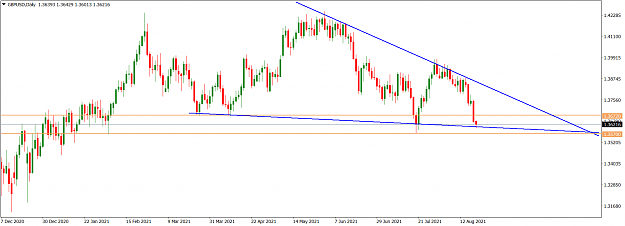
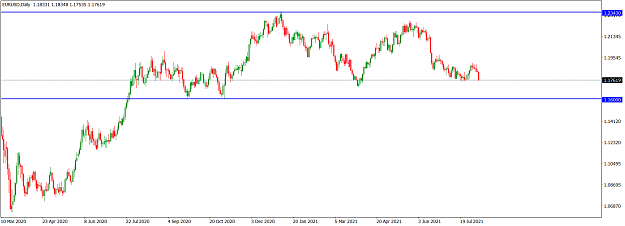
The 1.23430/1.16000 range (blue) is the prevailing trading range on the daily time frame. Price action is presently southwards and at the lower part of the range. Technically, we can expect further bearish move to retest the lower boundary of the trading range around 1.16000 before significant bullish resistance.
I may be wrong. Trade safe and prosper.
KP
In December 2020, EURUSD market operation rejected the 1.21940/1.24720 supply zone (red), and multi-year horizontal resistance, on the monthly time frame, but there was a retest of the zone in May 2021 before a southward turnaround. Technically, the EURUSD is under a bearish pressure, although on the monthly timeframe market operation was sideways in July. Further bearish drive will likely see the completion of an ‘M’ pattern around the 1.16000 handle (green).
Attached Image (click to enlarge)
On the weekly time frame, the printing of top-wicked candlesticks over several weeks at the 1.21940/1.24720 supply zone (red), and a multi-year horizontal resistance, seen on the monthly time frame technically favours bears. Recent order flow context, particularly with the bearish swing that began eight weeks ago, shows the intention of bears to maintain market influence. Furthermore, the fact that last week’s market operation printed an indecision candlestick as opposed to the bullish retracing print of two weeks ago indicates a weakening of bullish pressure. Thus, on the weekly time frame, the technicals give an edge to bears.
Attached Image (click to enlarge)
The 1.23430/1.16000 range (blue) is the prevailing trading range on the daily time frame. Price action is presently southwards and at the lower part of the range. Technically, we can expect further bearish move to retest the lower boundary of the trading range around 1.16000 before significant bullish resistance.
Attached Image (click to enlarge)
I may be wrong. Trade safe and prosper.
KP
Do your homework, follow the footprints of smart money
1