Hello everyone,
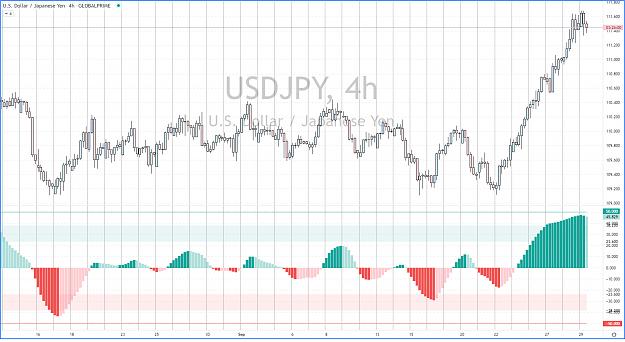
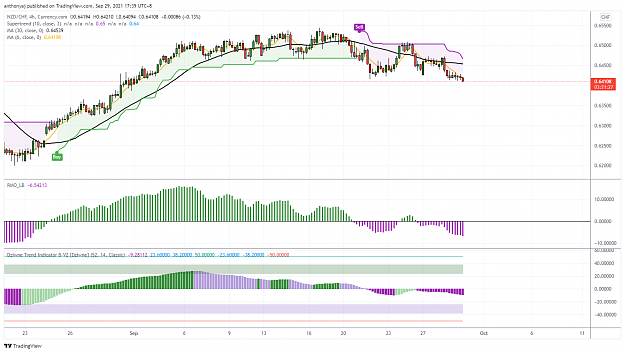
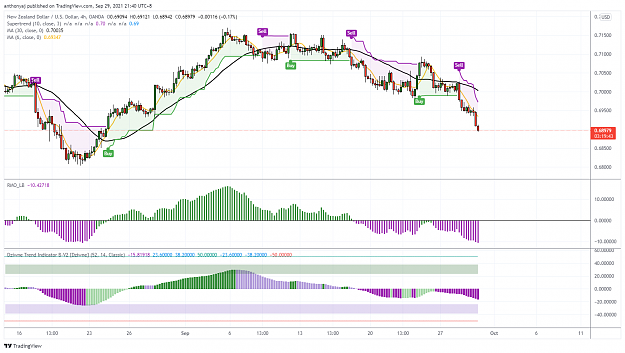
I have been using the indicator below on TradingView, is it possible to create an MT4 version from the code below.
Regards,
Anthony
//@version=4
// This source code is subject to the terms of the Mozilla Public License 2.0 at https://mozilla.org/MPL/2.0/
//————————————————————————————————————————————————————————————————————————————
//——————————————————————————— Auteur | Dziwne ——————————————————————————————
//————————————————————————————————————————————————————————————————————————————
study(title="Trend Indicator B-V2 (Momentum mesuring) [Dziwne]", shorttitle="Dziwne Trend Indicator B-V2 [Dziwne]", resolution="")
//————————————————————————————————————————————————————————————————————————————
//—————————————————————————————— I. Paramètres ———————————————————————————————
//————————————————————————————————————————————————————————————————————————————
ema = input(defval=14, minval=1, title="EMA Length")
ema_smooth = input(defval=14, minval=1, title="EMA Length (Smoothing)")
colors = input(title = "Color Scheme", defval="Classic", options=["Classic", "Dziwne Color Scheme"])
show = input(true, "Show Lines & Filling")
//————————————————————————————————————————————————————————————————————————————
//——————————————————————————— II.1. Calcules, EMA ————————————————————————————
//————————————————————————————————————————————————————————————————————————————
o = ema(open, ema)
c = ema(close, ema)
h = ema(high, ema)
l = ema(low, ema)
//————————————————————————————————————————————————————————————————————————————
//————————————————————————— II.2. Calcules, Heikin Ashi ——————————————————————
//————————————————————————————————————————————————————————————————————————————
ha_t = heikinashi(syminfo.tickerid)
ha_o = security(ha_t, timeframe.period, o)
ha_c = security(ha_t, timeframe.period, c)
ha_h = security(ha_t, timeframe.period, h)
ha_l = security(ha_t, timeframe.period, l)
//————————————————————————————————————————————————————————————————————————————
//————————————————— II.3. Calcules, EMA (Réduction du bruit) —————————————————
//————————————————————————————————————————————————————————————————————————————
ha_o_smooth = ema(ha_o, ema_smooth)
ha_c_smooth = ema(ha_c, ema_smooth)
ha_h_smooth = ema(ha_h, ema_smooth)
ha_l_smooth = ema(ha_l, ema_smooth)
//————————————————————————————————————————————————————————————————————————————
//—————————————————— II.4. Calcules, Echelle %, Puissance ———————————————————
//————————————————————————————————————————————————————————————————————————————
dif_oc = ha_c_smooth - ha_o_smooth
dif_hl = ha_h_smooth - ha_l_smooth
variable_oc_percent = dif_oc * 100 / dif_hl
//————————————————————————————————————————————————————————————————————————————
//————————————————— II.5. Calcules, Définition des couleurs ——————————————————
//————————————————————————————————————————————————————————————————————————————
couleur_positive = colors == "Classic" ? #26A69A : #FFBE3D
couleur_negative = colors == "Classic" ? #EF5350 : #D63031
couleur_positive_2 = colors == "Classic" ? #B2DFDB : #ffd88a
couleur_negative_2 = colors == "Classic" ? #FFCDD2 : #e37071
couleur_uptrend = change(dif_oc) >= 0 ? couleur_positive : couleur_positive_2
couleur_downtrend = change(dif_oc) <= 0 ? couleur_negative : couleur_negative_2
couleur_trend = dif_oc <= 0 ? couleur_downtrend : couleur_uptrend
couleur_show_positive = show ? couleur_positive : na
couleur_show_negative = show ? couleur_negative : na
//————————————————————————————————————————————————————————————————————————————
//———————————————————————————— III. Mise en place ————————————————————————————
//————————————————————————————————————————————————————————————————————————————
plot(variable_oc_percent, style=plot.style_columns, color=couleur_trend, title="Trend Momentum Indicator")
fib_236_positive = plot(23.6, color=na, title="23.6% Fibonacci")
fib_382_positive = plot(38.2, color=na, title="38.2% Fibonacci")
plot(50, color=couleur_show_positive, title="50% Fibonacci")
fib_236_negative = plot(-23.6, color=na, title="-23.6% Fibonacci")
fib_382_negative = plot(-38.2, color=na, title="-38.2% Fibonacci")
plot(-50, color=couleur_show_negative, title="-50% Fibonacci")
fill(fib_236_positive, fib_382_positive, color=couleur_show_positive, title="Positive Momentum Rejection-zone")
fill(fib_236_negative, fib_382_negative, color=couleur_show_negative, title="Negative Momentum Rejection-zone")
//————————————————————————————————————————————————————————————————————————————
//—————————————————————————————————— FIN —————————————————————————————————————
//————————————————————————————————————————————————————————————————————————————
I have been using the indicator below on TradingView, is it possible to create an MT4 version from the code below.
Regards,
Anthony
//@version=4
// This source code is subject to the terms of the Mozilla Public License 2.0 at https://mozilla.org/MPL/2.0/
//————————————————————————————————————————————————————————————————————————————
//——————————————————————————— Auteur |
//————————————————————————————————————————————————————————————————————————————
study(title="Trend Indicator B-V2 (Momentum mesuring) [Dziwne]", shorttitle="Dziwne Trend Indicator B-V2 [Dziwne]", resolution="")
//————————————————————————————————————————————————————————————————————————————
//—————————————————————————————— I. Paramètres ———————————————————————————————
//————————————————————————————————————————————————————————————————————————————
ema = input(defval=14, minval=1, title="EMA Length")
ema_smooth = input(defval=14, minval=1, title="EMA Length (Smoothing)")
colors = input(title = "Color Scheme", defval="Classic", options=["Classic", "Dziwne Color Scheme"])
show = input(true, "Show Lines & Filling")
//————————————————————————————————————————————————————————————————————————————
//——————————————————————————— II.1. Calcules, EMA ————————————————————————————
//————————————————————————————————————————————————————————————————————————————
o = ema(open, ema)
c = ema(close, ema)
h = ema(high, ema)
l = ema(low, ema)
//————————————————————————————————————————————————————————————————————————————
//————————————————————————— II.2. Calcules, Heikin Ashi ——————————————————————
//————————————————————————————————————————————————————————————————————————————
ha_t = heikinashi(syminfo.tickerid)
ha_o = security(ha_t, timeframe.period, o)
ha_c = security(ha_t, timeframe.period, c)
ha_h = security(ha_t, timeframe.period, h)
ha_l = security(ha_t, timeframe.period, l)
//————————————————————————————————————————————————————————————————————————————
//————————————————— II.3. Calcules, EMA (Réduction du bruit) —————————————————
//————————————————————————————————————————————————————————————————————————————
ha_o_smooth = ema(ha_o, ema_smooth)
ha_c_smooth = ema(ha_c, ema_smooth)
ha_h_smooth = ema(ha_h, ema_smooth)
ha_l_smooth = ema(ha_l, ema_smooth)
//————————————————————————————————————————————————————————————————————————————
//—————————————————— II.4. Calcules, Echelle %, Puissance ———————————————————
//————————————————————————————————————————————————————————————————————————————
dif_oc = ha_c_smooth - ha_o_smooth
dif_hl = ha_h_smooth - ha_l_smooth
variable_oc_percent = dif_oc * 100 / dif_hl
//————————————————————————————————————————————————————————————————————————————
//————————————————— II.5. Calcules, Définition des couleurs ——————————————————
//————————————————————————————————————————————————————————————————————————————
couleur_positive = colors == "Classic" ? #26A69A : #FFBE3D
couleur_negative = colors == "Classic" ? #EF5350 : #D63031
couleur_positive_2 = colors == "Classic" ? #B2DFDB : #ffd88a
couleur_negative_2 = colors == "Classic" ? #FFCDD2 : #e37071
couleur_uptrend = change(dif_oc) >= 0 ? couleur_positive : couleur_positive_2
couleur_downtrend = change(dif_oc) <= 0 ? couleur_negative : couleur_negative_2
couleur_trend = dif_oc <= 0 ? couleur_downtrend : couleur_uptrend
couleur_show_positive = show ? couleur_positive : na
couleur_show_negative = show ? couleur_negative : na
//————————————————————————————————————————————————————————————————————————————
//———————————————————————————— III. Mise en place ————————————————————————————
//————————————————————————————————————————————————————————————————————————————
plot(variable_oc_percent, style=plot.style_columns, color=couleur_trend, title="Trend Momentum Indicator")
fib_236_positive = plot(23.6, color=na, title="23.6% Fibonacci")
fib_382_positive = plot(38.2, color=na, title="38.2% Fibonacci")
plot(50, color=couleur_show_positive, title="50% Fibonacci")
fib_236_negative = plot(-23.6, color=na, title="-23.6% Fibonacci")
fib_382_negative = plot(-38.2, color=na, title="-38.2% Fibonacci")
plot(-50, color=couleur_show_negative, title="-50% Fibonacci")
fill(fib_236_positive, fib_382_positive, color=couleur_show_positive, title="Positive Momentum Rejection-zone")
fill(fib_236_negative, fib_382_negative, color=couleur_show_negative, title="Negative Momentum Rejection-zone")
//————————————————————————————————————————————————————————————————————————————
//—————————————————————————————————— FIN —————————————————————————————————————
//————————————————————————————————————————————————————————————————————————————