{quote} No, same as RobinHood who is trading now mainly stocks, I would like to use this system outside MT4, to cover other assets as well. On the other side, let's be honest, MT4 is an old platform, nothing wrong with it, it still does the job perfectly, but for me, it's much easier to monitor charts in TrandingView for example. So to break this task in multiple steps, there are various things which can be done, independent from each other. Personally, I would love to have the indicators and create a template for TradingView. But the main thing...
Ignored
Have you (or anyone) recreated the indicators for TV?
Thank you.
{quote} Have you (or anyone) recreated the indicators for TV? Thank you.
Ignored
Good morning, I’ve done it, or pretty darn close at least. I have a post above somewhere you should be able to find by looking at my previous posts which contains a screenshot to get you started and once I get to my pc in an hour or so I’ll post some detailed instructions for you on how I did it. I used existing indicators and adapted to my needs.
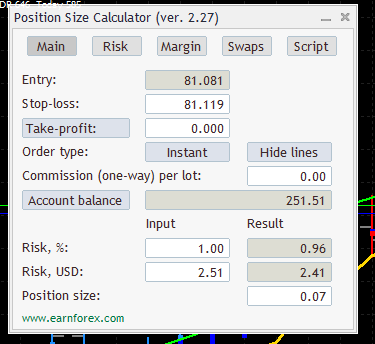
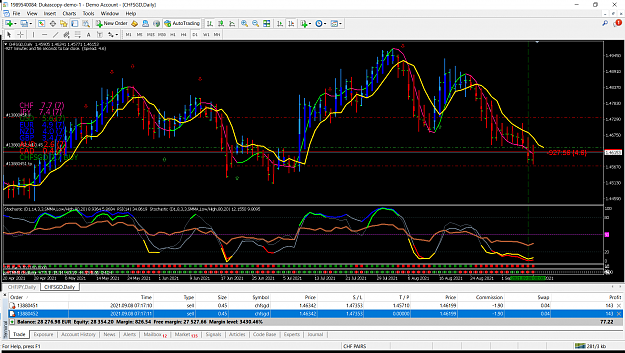
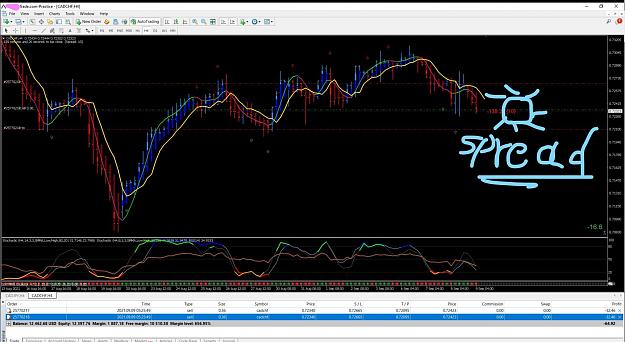
{quote} Well,I 'm trying different money managment methods at different accounts,so i redefine the lot size accordingly. In my live 1D account i use 2% risk (1+1 POSITIONS),with 1.5 ATR SL,1 ATR 1st T/P and open the 2nd trade.Trailing stop at 2ATR Not very often my S/L gets hited. All backtests posted are made in the same way. I my live 15 M account i divide 20% of my trading capital by 25 and the number resulting from division is my lot size.(25 is the number of my potential loss).{image}
Ignored
Thanks for sharing.
Always a Student, Never a Master - Emulate What Works
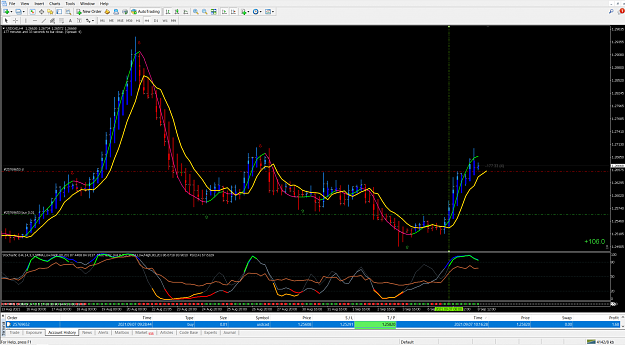
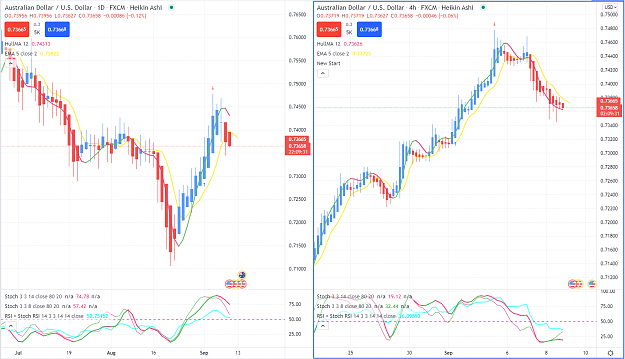
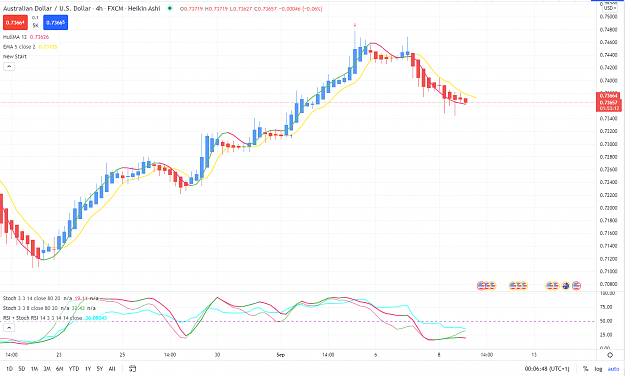
Hope you're all well. I wondered how you guys treat scenarios like the one in the screenshot attached. The 1D chart is on the left and 4H on the right.
The 4H showed a solid crossover entry on the second red HA candle however, the daily chart at that point was still mid-way through the blue 'long-legged' doji candle and still in an upward trend.
I'm just curious how people approach these entries and do you do anything differently when taking potential daily reversals like this. I feel a strategy for taking these sort of signals is missing from my trading plan and wanted to hear from everyone else.
{quote} Have you (or anyone) recreated the indicators for TV? Thank you.
Ignored
Here goes, i'll try explain as best i can.
5 EMA shift + 2 should be easy enough for you to put on.
Hull MA by Mohamed982
HA candles
All applied to the same lower pane :-
Stochastic by nicebo x2 with the lengths specified by Robinhood (toggle D line OFF to show just the single K line)
RSI + Stochastic RSI indicator combined by BCryptological (Remove all other lines except the RSI line)
Merge the scales on the right hand side of the lower window so you have a single 1-100 scale. Use the settings on one of the stochastic indicators to add a 50 line.
I have attached below a screenie of my setup. It shouldnt take long, you will have to swap around the settings on some of the idies to make it look clean, ive made some suggestions above, colour it up so it is similar to Robinhoods original template for ease of interpretation.
{quote} Here goes, i'll try explain as best i can. 5 EMA shift + 2 should be easy enough for you to put on. Hull MA by Mohamed982 HA candles All applied to the same lower pane :- Stochastic by nicebo x2 with the lengths specified by Robinhood (toggle D line OFF to show just the single K line) RSI + Stochastic RSI indicator combined by BCryptological (Remove all other lines except the RSI line) Merge the scales on the right hand side of the lower window so you have a single 1-100 scale. Use the settings on one of the stochastic indicators to add...
Ignored
Just by aware and don't use ha candle directly from tv, because most indicator take close/open/high/low from chart bars in this case ha and you need the indicator calculation from real price (you can see a slightly difference)
I recommend use Heikin Ashi by garethyeo and then move to chart and hide border, body and wick for Japanese candles . Don't forget "pint to scale A"
{quote} Just by aware and don't use ha candle directly from tv, because most indicator take close/open/high/low from chart bars in this case ha and you need the indicator calculation from real price (you can see a slightly difference) I recommend use Heikin Ashi by garethyeo and then move to chart and hide border, body and wick for Japanese candles . Don't forget "pint to scale A"
Ignored
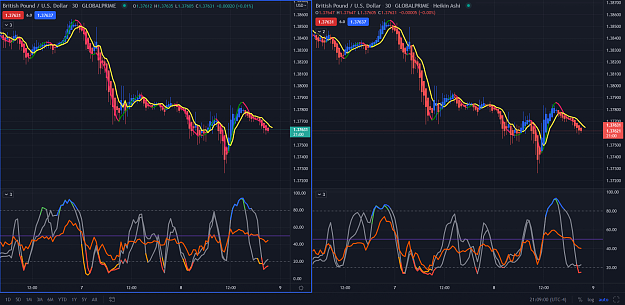
look at the difference (right use tv ha directly).
When use ha directly from tv, If the indicator isn't programmed for use real price, it's will used the ha price, even in last price line.
Hope you're all well. I wondered how you guys treat scenarios like the one in the screenshot attached. The 1D chart is on the left and 4H on the right. The 4H showed a solid crossover entry on the second red HA candle however, the daily chart at that point was still mid-way through the blue 'long-legged' Doji candle and still in an upward trend. I'm just curious how people approach these entries and do you do anything differently when taking potential daily reversals like this. I feel a strategy for taking these sorts of signals is missing from...
Ignored
If I understood the question well...When you have a signal on your 4H chart, then and only then you do go to the higher time frame to check if the trend is in the same direction as your signal. If not try to find another signal. If you want to trade the daily reversal you should go to the 1W chart to get confirmation.
{quote} Here goes, i'll try explain as best i can. 5 EMA shift + 2 should be easy enough for you to put on. Hull MA by Mohamed982 HA candles All applied to the same lower pane :- Stochastic by nicebo x2 with the lengths specified by Robinhood (toggle D line OFF to show just the single K line) RSI + Stochastic RSI indicator combined by BCryptological (Remove all other lines except the RSI line) Merge the scales on the right hand side of the lower window so you have a single 1-100 scale. Use the settings on one of the stochastic indicators to add...
Ignored
Hello! Thank you for suggestions.
The stochastic would not be smma-based in this case. And APB (average price bars) would me missing. Otherwise, it's totally fine.
Do people rely on heiken to change colours, APB not needed?