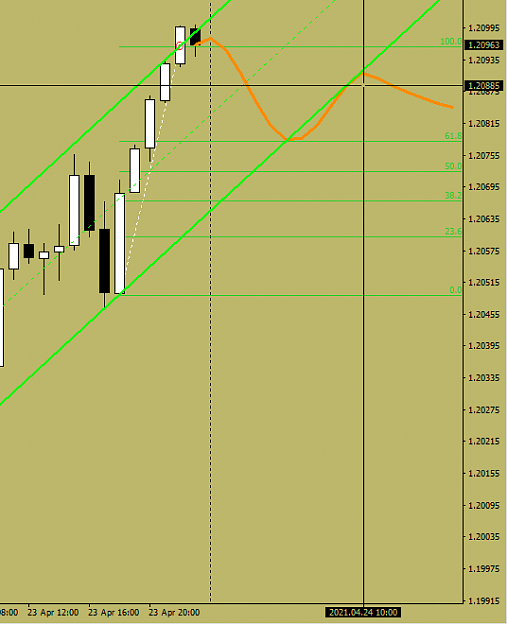
Dislikedstill happy with my losing short. it was the right move for me. I expected deep pullback according my rules. everything was correct technically for me. moment bears lost it imho i.e moment big banks stepped in the last hour to change the tide. even at this point it was 63% bearish retail sentiment (despite increasing 80 pips!). perhaps this is why they stepped in. i wont b changnig anything and the rationale will allow me to sleep at night. {image}Ignored
Next week is a new week, new opportunities, and the EU will give back some dollars if we stalk it with precision, care and determination!
1