• Home
  • Forums
  • Trades
  • News
  • Calendar
  • Market
  • Brokers
  • Login
  • Join
  • User/Email: Password:
  • 9:52pm
Menu
  • Forums
  • Trades
  • News
  • Calendar
  • Market
  • Brokers
  • Login
  • Join
  • 9:52pm
Sister Sites
  • Metals Mine
  • Energy EXCH
  • Crypto Craft

Options

Bookmark Thread

First Page First Unread Last Page Last Post

Print Thread

Similar Threads

Are you a trend trader or a counter-trend trader? 29 replies

Is Grid Trading (combined trend following and counter trend) Profitable? 3 replies

Ichi Trend & RSI Trend Catch 4 replies

Automatic Trend line, trend channel, support, resistance detection 3 replies

"Trend" , how do you actually trace the current trend ? 23 replies

  • Trading Discussion
  • /
  • Reply to Thread
  • Subscribe
  • 112
Attachments: Trend Trading
Exit Attachments

Trend Trading

  • Last Post
  •  
  • 1 2829303132 Page 33
  • 1 303132 Page 33
  •  
  • Post #641
  • Quote
  • Apr 8, 2021 9:04am Apr 8, 2021 9:04am
  •  AlbinaGrande
  • | Joined Feb 2012 | Status: Member | 260 Posts
Quoting Graviton
Disliked
I only have 2 out of 28 pairs that meet my criteria for swing trends today, chfjpy long and eurjpy long. I'm tempted to add acceptable criteria for shorter duration trends, but I am reminded of a very successful trend following trader who simply has a program running and hasn't touched it in 10 years. Some months he wins and some he loses, but over the long haul he's beating the hell out of most of his competition. There are many risks in this business and ultimately we are paid to manage risks wisely. This is the risk of boredom.... - G
Ignored
I am using this time to build a new carport .. jajajaja
Do not dwell in the past, do not dream of the future, concentrate the mind.
 
 
  • Post #642
  • Quote
  • Edited at 11:48am Apr 8, 2021 11:20am | Edited at 11:48am
  •  MIC85POU
  • | Joined Mar 2021 | Status: Member | 37 Posts
Hey guys,

I have kind of a newbie question if you don't mind

How do you know the difference between a retracement and a trend reversal?
Is there an effective way to know whether using price action or indicators like stochastic, volume, MACD, MA or Multi Timeframe analysis?

Because every time the trend starts to pullback I never know what to expect and how to make sure if it's one or the other

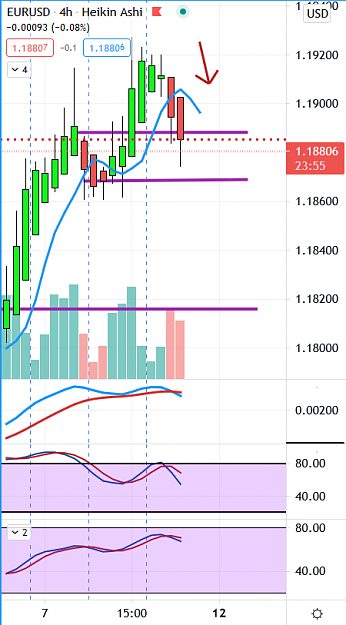
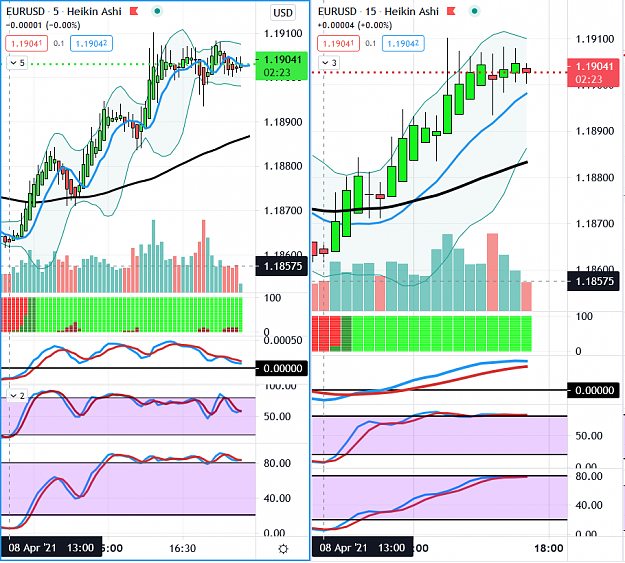
For example: For the chart below, the green volume bar tells me when the pullback seems to be over but if you don't want to get out on the pullback and stay in, how do you know before it happens that it's just a pullback on the first and second retracement that it's not just gonna reverse completely and stop going up but instead going down? How do you tell if the trend is bound to continue on the upside or if it's done and the trend is now heading down? Is there any way to tell?

Attached Image (click to enlarge)
Click to Enlarge

Name: Screenshot (56).png
Size: 73 KB


That's a 5min chart. But when I switch to my 15min chart, I see that for that specific trend, MACD keeps going up and I'm thinking that MACD on the 15min could be the way to know for sure if it's just a pullback or a complete reversal on the 5min chart. What do you think?

Attached Image (click to enlarge)
Click to Enlarge

Name: Screenshot (57).png
Size: 125 KB


Thanks
Mike
 
 
  • Post #643
  • Quote
  • Apr 8, 2021 12:38pm Apr 8, 2021 12:38pm
  •  Graviton
  • Joined Apr 2010 | Status: Member | 1,096 Posts
Quoting MIC85POU
Disliked
Hey guys, I have kind of a newbie question if you don't mind How do you know the difference between a retracement and a trend reversal? Is there an effective way to know whether using price action or indicators like stochastic, volume, MACD, MA or Multi Timeframe analysis? Because every time the trend starts to pullback I never know what to expect and how to make sure if it's one or the other...
Ignored
Hi Mike. Your question goes right to the heart of what's probably the most important question of trend trading, how do we know when the trend is over? I have my thoughts on this critical question and I'll offer them soon, but I know some experienced traders that read this thread and I want to throw this question over to them first and get their opinion. So, anyone brave enough to comment on this critical question? - G
 
1
  • Post #644
  • Quote
  • Apr 8, 2021 2:22pm Apr 8, 2021 2:22pm
  •  Graviton
  • Joined Apr 2010 | Status: Member | 1,096 Posts
I'm not seeing much discussion, so I'll make a few comments on the question: When do we know the trend is over? First of all, there may be many trends in different time frames, like an up trend in the daily, and a down trend in the 4 hour and another up trend in the 1 hour. So there can't be a single correct answer to when the trend is over. A retracement trend on the 1 hour chart may reverse to the point that a trade in that timeframe gives back all it's profits, while the daily trend can continue with only a small bump. Even concentrating on a single timeframe, determining the end of a trend might only be possible after the fact. I'll make a controversial statement here, when trading a trend, trying to determine that the trend has ended in real time, even in just a single timeframe, may be akin to trying to predict the future, something that is simply impossible.

So my answer to the question of when do we know the trend is over is we only know for sure after the fact, and of course, that's too late to take our maximum profits. I can't say that someone somewhere hasn't discovered some magic method of determining just when a trend has ended, but for me, it's a matter of probabilities. If I can simply find an exit method that will give me a consistent edge in exiting with more profit than loss, then I have to be satisfied with that result. Questions, comments, differing opinions? - G
 
1
  • Post #645
  • Quote
  • Apr 8, 2021 6:18pm Apr 8, 2021 6:18pm
  •  Rub
  • | Joined Oct 2015 | Status: Member | 890 Posts
Quoting MIC85POU
Disliked
Hey guys, I have kind of a newbie question if you don't mind How do you know the difference between a retracement and a trend reversal? Is there an effective way to know whether using price action or indicators like stochastic, volume, MACD, MA or Multi Timeframe analysis? Because every time the trend starts to pullback I never know what to expect and how to make sure if it's one or the other For example: For the chart below, the green volume bar tells me when the pullback seems to be over but if you don't want to get out on the pullback and stay...
Ignored
I have a few methods I like to define the trend as being over. As graviton says there can be different trends depending on the time frame you're trading.

Sometimes you can recognise an exhaustion bar into a area of significant support or resistance. This is something that I can't do consistently, but generally gets you out bloody close to the top.

Higher lows in an uptrend or lower highs in a downtrend being violated is a pretty good indication the trend in at least paused, if not over. So trailing your stops behind them gives you a good chunk.

Use of a moving average as your line in the sand is one I've seen for a few systems. Just keep buying every signal above or selling every signal below until price closed across the moving average.

The main thing is to find a method the howling ape in your brain is comfortable with, and stick with it over the long haul. That's been the one that's tripped me up over the years.
 
 
  • Post #646
  • Quote
  • Edited at 8:43am Apr 9, 2021 1:58am | Edited at 8:43am
  •  MIC85POU
  • | Joined Mar 2021 | Status: Member | 37 Posts
Thank you both. Now that you say it, I don't think there's any way to say if the trend is going to reverse or not, it could pause for a while and resume or it simply could go straight down without ever bouncing back and the chart is always there to remind us that we don't have the gift of second sight. As you both said as long as you have a strategy to enter and then exit when you see some cues of a possible reversal with price action and a simple EMA crossing.

I've used all kinds of indicators in the past which I thought gave me confidence in the possible direction of a trend but when I think about it now it may have confused me more than it helped while in fact trend following, price action and a simple EMA could be the best tools I'd been looking for and simpler to use, though I like using volume, stochastic and MACD for entries and exits

As for resistance and support zones, may I ask how you use them, maybe wait for a possible breakout? Would you say these resistance are accurate?

Attached Image (click to enlarge)
Click to Enlarge

Name: Screenshot (59).png
Size: 47 KB


Thanks guys
 
 
  • Post #647
  • Quote
  • Edited at 12:32pm Apr 9, 2021 11:11am | Edited at 12:32pm
  •  Graviton
  • Joined Apr 2010 | Status: Member | 1,096 Posts
Hi Mike. I use resistance and support zones occasionally to help refine my exit points. So for instance if I have a tp set at 120 pips but there is a major resistance at 100 pips and price bounces sharply off it, I may want to exit with my profit. I can always re-enter later if it still looks good. If I have a sl just below a support zone and price blows through support I may exit early to save a few pips between the support and my usual stop loss.

The problem I have with resistance and support zones is they tend to be very subjective. No two traders will see them in exactly the same place. That violates my guideline that a good manual trading system should be constructed as if it's going to be programed into an EA, even if I intend to trade it manually. To program a system it must be deterministic and repeatable. If a system is very subjective and fails, it's difficult to understand just what failed. Was it my failure to properly identify the R/S zone in advance? (They are easy to see after the fact, of course.) Was it some other fundamental driver (like a Fed announcement) that sent price right thru the R/S zone? Is there something wrong with the way I'm implementing the R/S zones, like being to tight or too loose in identifying the range of the zone? Trying to determine exactly what failed and how I should improve it in the future is difficult for me. In the end I prefer simple and very deterministic methods, but that's just my opinion. Others may have a different take on R/S zone usage. I'd be happy to hear someone else's opinion on the subject. Happy Trading! - G

Edit: When I say I try to make my method deterministic, I'm speaking specifically of the entry and exit decisions. Of course the outcome of a trade is probabilistic. There I'm simply trying to increase the probability of a favorable outcome by making better deterministic decisions. Hopefully that's clear, sort of. - G
 
2
  • Post #648
  • Quote
  • Apr 9, 2021 12:00pm Apr 9, 2021 12:00pm
  •  MIC85POU
  • | Joined Mar 2021 | Status: Member | 37 Posts
I agree. I'd rather avoid seeing things that aren't there as well. I hadn't used them to be honest but heard a lot of people talking about them and was simply curious as to how they were being used in their strategy but I always had some trouble spotting them and use them properly. I'll see in the long run with more experience. Thanks a lot for your answer. In a very short time this forum had really helped me answer a lot of questions I had on my mind.
 
 
  • Post #649
  • Quote
  • Apr 9, 2021 5:57pm Apr 9, 2021 5:57pm
  •  Graviton
  • Joined Apr 2010 | Status: Member | 1,096 Posts
Glad to hear you got some answers Mike. Thanks to those who shared their knowledge and experience to help answer the questions here. I'd encourage anyone else with questions to submit them here and we'll try to find someone who can answer them. These questions are very helpful to me as they cause me to think deeply about things I do everyday out of (good or bad) habit. Happy Trading! - G
 
 
  • Post #650
  • Quote
  • Edited Apr 11, 2021 3:04am Apr 10, 2021 4:48am | Edited Apr 11, 2021 3:04am
  •  MIC85POU
  • | Joined Mar 2021 | Status: Member | 37 Posts
Thanks a lot
You too

Mike
 
 
  • Post #651
  • Quote
  • Apr 11, 2021 10:28pm Apr 11, 2021 10:28pm
  •  Graviton
  • Joined Apr 2010 | Status: Member | 1,096 Posts
There was a question posted here but now I don't see it, so I guess it was deleted. I'll do my best to answer it anyway. The question had to do with using moving average indicators to enter trades. The question was, if one is going to use moving average crosses to enter a trade, like a 5 ema crossing above a 20 ema to signal a long entry, wouldn't it get the trader in earlier just to use price crossing above the 20 ema as an entry signal. Yes, it would get the trader in earlier, but that doesn't mean it would yield better trade outcomes.

There is a trade off between entering a trade early and having the opportunity to make more pips, and taking many false entries that will result in lots of stop outs. We have to roll things back a bit to see that moving averages, like most indicators, don't predict the future. At best they simply indicate some increased probability that price will eventually continue moving in the direction of the moving average. Typically, the longer price has been moving in the direction of an indicator, the higher the probability that it will continue moving in that direction for some period of time. So what we are trying to do is use the indicator to indicate the probability that price is more likely to move to our take profit point than reverse before it hits that take profit point. Of course, the further away the take profit point, the less likely price will make it there before it reverses. It's another trade off.

My conclusion is that entering a trade earlier does not make a successful outcome more likely. In fact, an early entry may just be entering the trade on the random motion of market noise which can't be traded for a profit. Of course, entering the trade too late may put us in it just before a reversal, which must come eventually. Our goal then is to trade the middle of the trend for profit, avoiding the random motion that early on may appear to be a sustained trend, but can fail at any random time in the future, and avoiding the exhaustion and reversal that must come at the end of every good trend eventually. If anyone else has an opinion on this, I'd be glad to hear it. - G
 
1
  • Post #652
  • Quote
  • Edited at 7:37am Apr 12, 2021 1:38am | Edited at 7:37am
  •  MIC85POU
  • | Joined Mar 2021 | Status: Member | 37 Posts
Thank you for your answer Graviton.

I erased the original question because I didn't want to bother you guys with my too many questions.
But thanks for answering it because It helps me better understand why a longer moving average is important.

May I ask one last thing if you don't mind? What moving averages are you using if I may ask?
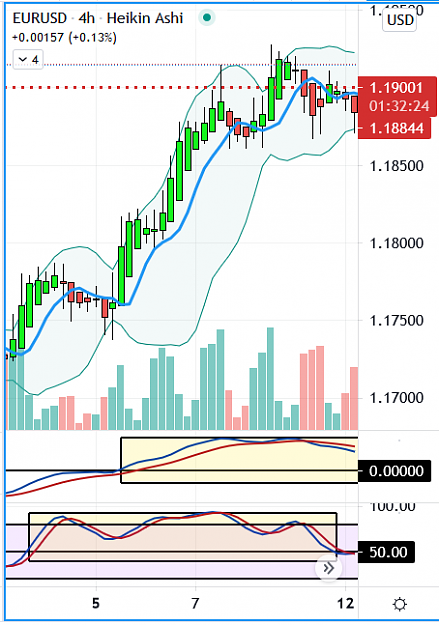
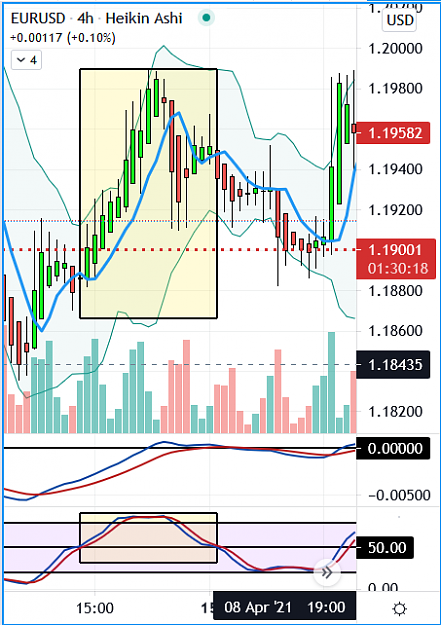
I've been using the 5 and 50 EMA on the 1H chart to determine the longer trend and the 15min chart for entries and exits but since I'm not as experienced as you all are there could be more appropriate moving averages for trend following on the 1H and 4H timeframes. Also, would you say it's possible to use a longer moving average on a shorter timeframe like the 5 or 15 minutes?

I've been using MACD and stochastic for a while and I'm wondering would it not be possible to use a moving average alternative like the crossing of the MACD's 0 line or the stochastic 50 line, as an indication a downtrend below 0 or 50 and an uptrend when above?

Similarly to MACD, I think the stochastic 50 line could be used as a trend indication. What do you guys think?
I know some say stochastic can't help with the trend, that it's a momentum oscillator but when I look at the 4H chart with both stochastic 50 line and MACD 0 line, I can't help but notice that sotchastic seems to be giving us the trend when it's above or below the 50 line similar to MACD but even sooner than MACD
So far stochastic gave me some reliable signals regarding the trend no matter if it's a trend indicator or not so I don't know what to think

Here's an example:

Attached Image (click to enlarge)
Click to Enlarge

Name: Screenshot (64).png
Size: 51 KB
Attached Image (click to enlarge)
Click to Enlarge

Name: Screenshot (65).png
Size: 61 KB


Thank you
Mike
 
 
  • Post #653
  • Quote
  • Apr 12, 2021 10:26am Apr 12, 2021 10:26am
  •  AlbinaGrande
  • | Joined Feb 2012 | Status: Member | 260 Posts
Hi Mike,

I am happy that you have taken so much interest in G's thread. He has helped me enormously in the past.

A couple of comments that might help, tho I do not trade the lower TFs. G will know much better.

First, I think it may help to build a narrative as relates to your Trade. Think of the Trade as a living thing or a novella in progress. The past and present are clear enough, but the future remains a mystery. But, you can anticipate with varying degrees of confidence, pending circumstances, which various pathways are more or less likely to unfold. These comments should pertain to all Time frames.

Also, I use several TFs for review( typically D1, H4 when trading on H1) and 2 or 3 MVAs( 5, 21, 200). I set my MACD to reflect the MA pair that is in my trading focus and not the default settings. So, if my trading couplet is 5,21, then MACD is 5, 21, 9 or perhaps a tad faster, 5,18,9. I like Stochs set to 8,3,3 and watch for movement away from 20, 80 in anticipation of a 50 cross, but only for a momentum guide.

I have marked up one of your recent examples, EU on 5mn because it tells a nice story. You start on the far left in Consolidation. Then follows a Breakout, Pull Back, another Breakout with a Pull Back followed by one more BO and PB before stalling out. This is a classic picture as described almost 90 years ago by Richard Donchian. He liked to trade mini PBs when they broke away from Pennants crossing mini Trendlines.

You might Google Richard Donchian if you do not know of him.


Hope this is of some help,
AG

PS, It appears that I can not upload the image for some reason.
Do not dwell in the past, do not dream of the future, concentrate the mind.
 
 
  • Post #654
  • Quote
  • Apr 12, 2021 1:22pm Apr 12, 2021 1:22pm
  •  MIC85POU
  • | Joined Mar 2021 | Status: Member | 37 Posts
Quoting AlbinaGrande
Disliked
Hi Mike, I am happy that you have taken so much interest in G's thread. He has helped me enormously in the past. A couple of comments that might help, tho I do not trade the lower TFs. G will know much better. First, I think it may help to build a narrative as relates to your Trade. Think of the Trade as a living thing or a novella in progress. The past and present are clear enough, but the future remains a mystery. But, you can anticipate with varying degrees of confidence, pending circumstances, which various pathways are more or less likely to...
Ignored

Thank you so much for these precious advice
Indeed, if there's one thing that seems prevalent in following the trend is that you know what you have but you can't predict the future, everyone seems to agree on that and I read somewhere it's better to remove the would be / should be and focus on what you can see. So I'm not the only one using MACD and Stoch, that's good to know


I like the idea of a story. I know the Donchian channel from name but I never used it and don't know the story behind it. I'll definitely look him up see what I can learn from him. I've also applied the 5,21 settings and it's seems better than the default settings I've used so far. Thanks for that
 
1
  • Post #655
  • Quote
  • Apr 12, 2021 9:30pm Apr 12, 2021 9:30pm
  •  Graviton
  • Joined Apr 2010 | Status: Member | 1,096 Posts
Quoting MIC85POU
Disliked
May I ask one last thing if you don't mind? What moving averages are you using if I may ask? I've been using the 5 and 50 EMA on the 1H chart to determine the longer trend and the 15min chart for entries and exits but since I'm not as experienced as you all are there could be more appropriate moving averages for trend following on the 1H and 4H timeframes. Also, would you say it's possible to use a longer moving average on a shorter timeframe like the 5 or 15 minutes? I've been using MACD and stochastic for a while and I'm wondering would it not...
Ignored
Mike, since I'm swing trading I usually use longer period moving averages like 50 to 500 periods. Those moving averages don't tell me anything I can't see on a bare price chart, but the cross of the averages, like the "golden cross" of the 50 over the 200, does provide a definitive and repeatable signal for my trading. I do use longer moving averages on the shorter timeframes to help with picking entry points.

The MACD is another way to look at what a faster and slower moving average are doing, converging, diverging or consolidating. I'm not an expert MACD trader so I'll leave that to others. In my opinion, there isn't any additional information contained in any indicator that isn't contained in the raw price data, and the raw price data may contain information that is difficult to see in an indicator, like support and resistance zones, gaps, etc., so I don't want to be distracted from what's really happening with price by too many indicators. The benefit to me of the moving averages is I can easily use them to give me definitive and repeatable signals for entries and exits. Right now, i only have 3 moving averages on my charts, a medium, slow and very slow. It works for me but may be too slow for someone trading a 1 day duration rather than my 2 week duration. Happy Trading! - G
 
 
  • Post #656
  • Quote
  • Apr 13, 2021 8:08am Apr 13, 2021 8:08am
  •  MIC85POU
  • | Joined Mar 2021 | Status: Member | 37 Posts
Quoting Graviton
Disliked
{quote} The benefit to me of the moving averages is I can easily use them to give me definitive and repeatable signals for entries and exits. Right now, i only have 3 moving averages on my charts, a medium, slow and very slow. It works for me but may be too slow for someone trading a 1 day duration rather than my 2 week duration. Happy Trading! - G
Ignored
I get it. It depends on the timeframe you're trading
Thanks for your help

Mike
 
 
  • Post #657
  • Quote
  • Last Post: Apr 13, 2021 10:18am Apr 13, 2021 10:18am
  •  Graviton
  • Joined Apr 2010 | Status: Member | 1,096 Posts
Quoting MIC85POU
Disliked
{quote} I get it. It depends on the timeframe you're trading Thanks for your help Mike
Ignored
That's right. As far as the stoch goes, I haven't traded it in a very long time, but from what I remember, it seems to work well except when it gets "stuck" for a long time at a very high or very low value. For me, that was a signal that the pair might be in a steady trend, and if I flip to the next timeframe up, I'd often see an entry signal, say a crossing up from below 20%, and a steady tradeable trend up. Of course, these things are easy to see in hindsight. Seeing them in real time is more challenging and trading them for a profit is hard as hell, but probably not impossible. - G
 
1
  • Trading Discussion
  • /
  • Trend Trading
  • Reply to Thread
    • 1 2829303132 Page 33
    • 1 303132 Page 33
0 traders viewing now
Top of Page
  • Facebook
  • Twitter
About FF
  • Mission
  • Products
  • User Guide
  • Media Kit
  • Blog
  • Contact
FF Products
  • Forums
  • Trades
  • Calendar
  • News
  • Market
  • Brokers
  • Trade Explorer
FF Website
  • Homepage
  • Search
  • Members
  • Report a Bug
Follow FF
  • Facebook
  • Twitter

FF Sister Sites:

  • Metals Mine
  • Energy EXCH
  • Crypto Craft

Forex Factory® is a brand of Fair Economy, Inc.

Terms of Service / ©2022