USDCAD Weekly Technical Outlook
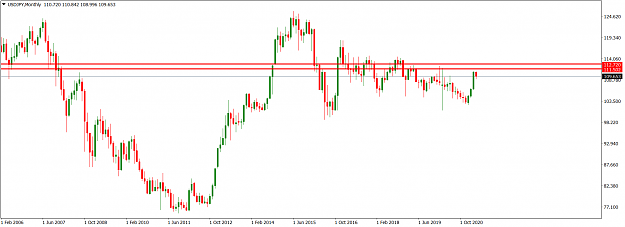
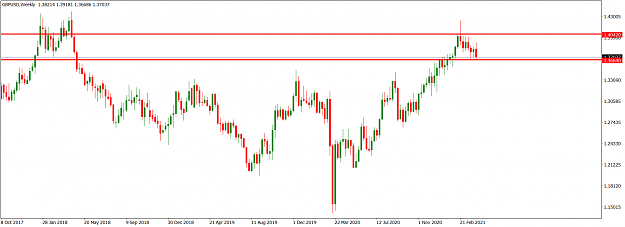
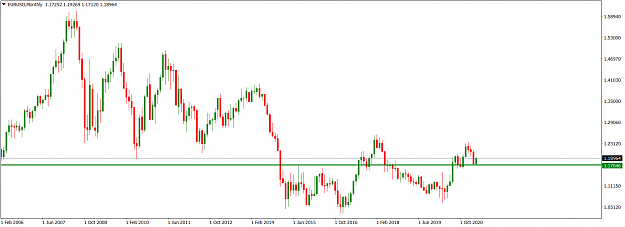
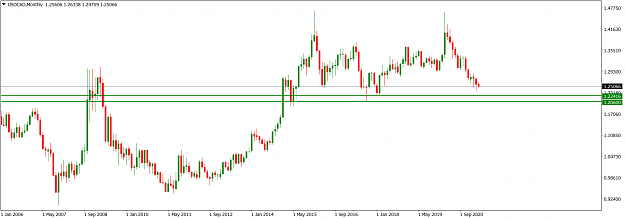
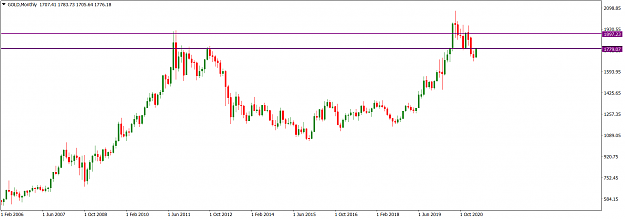
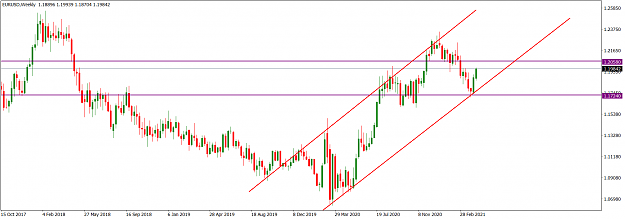
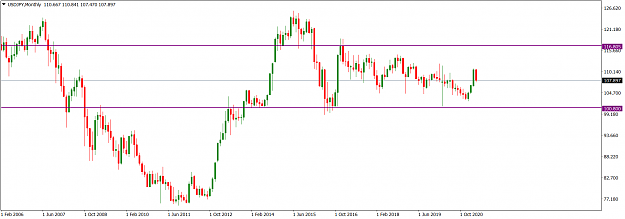
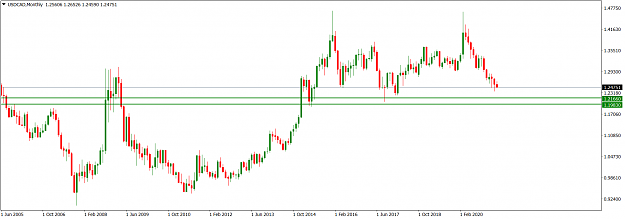
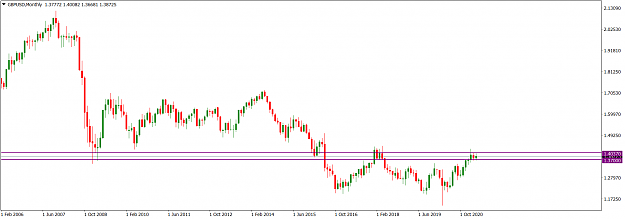
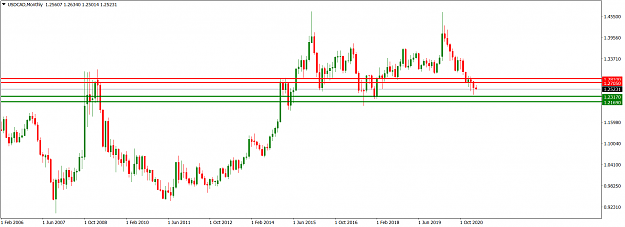
The USDCAD market is still in a bearish mode after the bearish breakdown of the 1.28100/1.27050 consolidation area (red) in March. On the monthly time frame, the March market operation surged to the near boundary of the 1.23170/1.21690 horizontal support area (green) before retracing from it. Technically, we may expect bears to make further, and determined, attempt to expose the area.
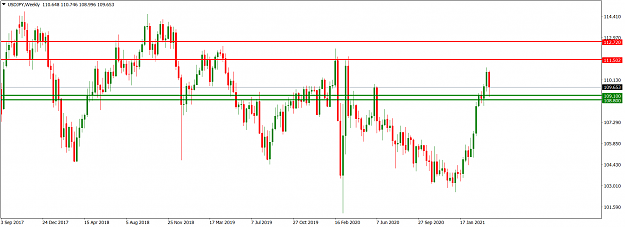
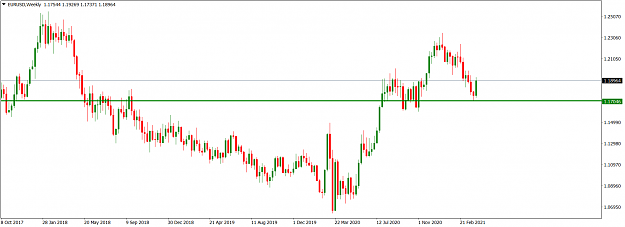
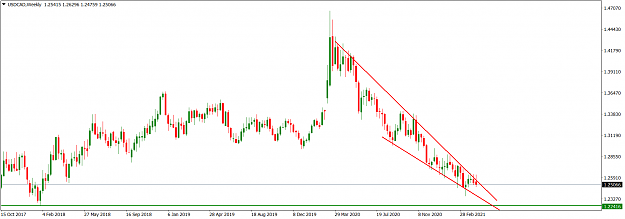
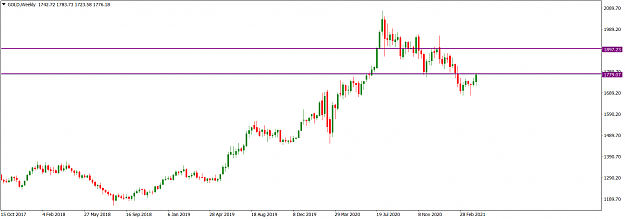
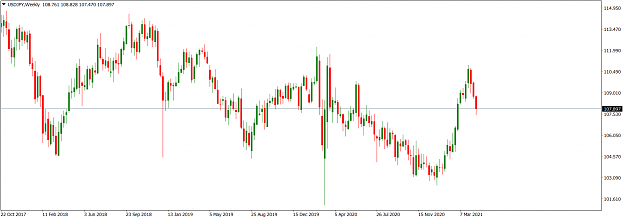
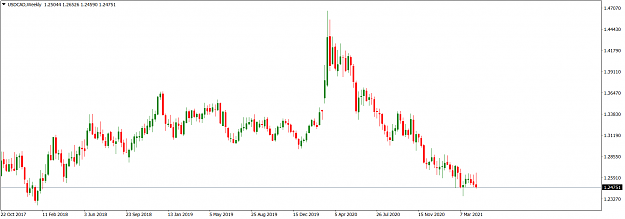
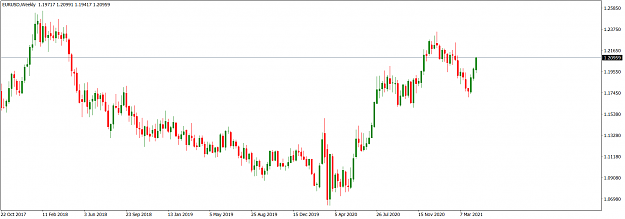
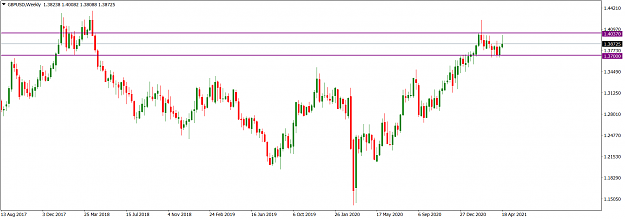
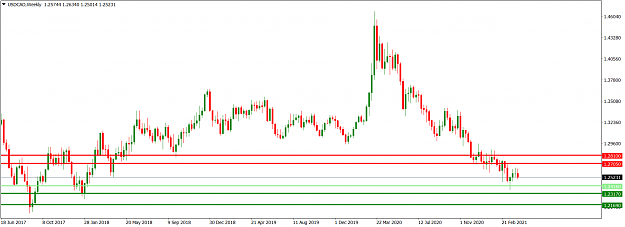
There was a recent northward pullback on USDCAD the weekly time frame. However, recent technical patterns on the USDCAD weekly time frame favour a bearish continuation. This may start with the breaching of the 1.246160 minor horizontal support area (light green) in the early part of this week.
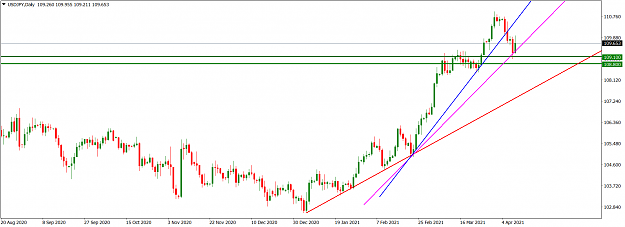
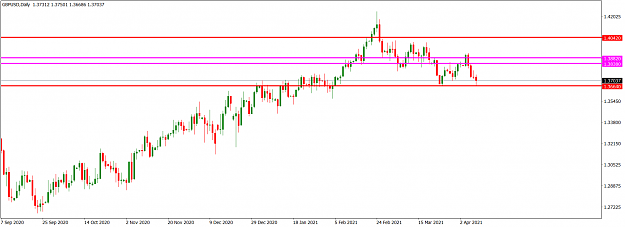
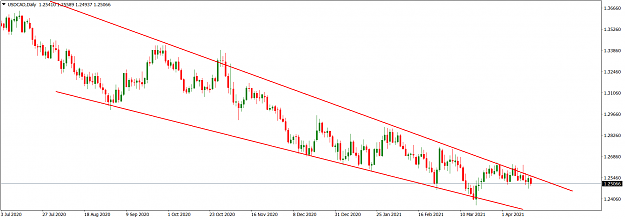
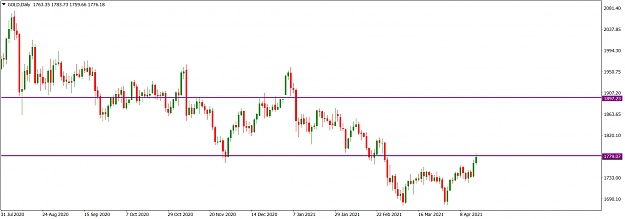
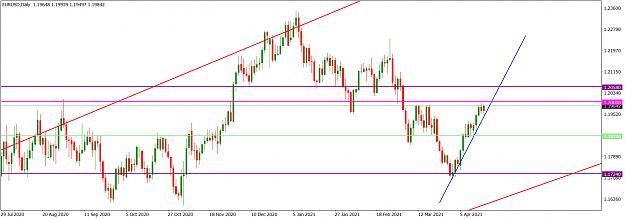
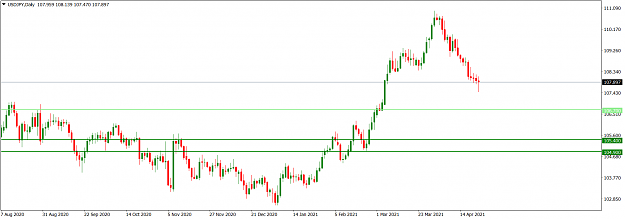
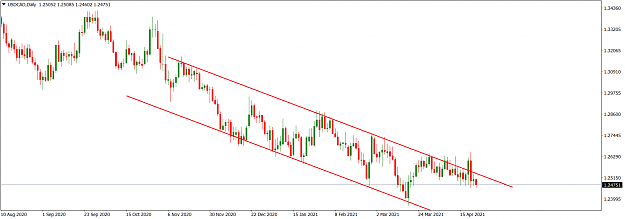
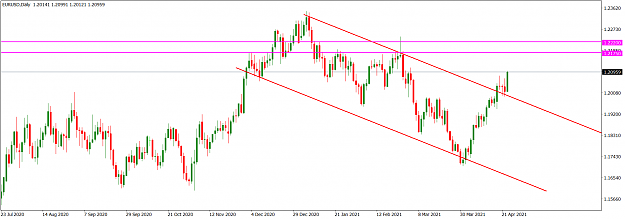
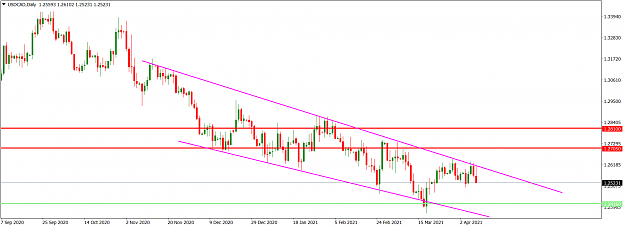
On the daily time frame, price action is in a falling wedge (magenta). Presently, price action is sideways, but the general technical mode is bearish. Bears seized the initiative on Thursday after price action got to the wedge resistance trendline. The bearish inverted hammer-like candlestick printed on Friday technically portends a bearish continuation.
I may be wrong. Trade safe and prosper.
KP
The USDCAD market is still in a bearish mode after the bearish breakdown of the 1.28100/1.27050 consolidation area (red) in March. On the monthly time frame, the March market operation surged to the near boundary of the 1.23170/1.21690 horizontal support area (green) before retracing from it. Technically, we may expect bears to make further, and determined, attempt to expose the area.
Attached Image (click to enlarge)
There was a recent northward pullback on USDCAD the weekly time frame. However, recent technical patterns on the USDCAD weekly time frame favour a bearish continuation. This may start with the breaching of the 1.246160 minor horizontal support area (light green) in the early part of this week.
Attached Image (click to enlarge)
On the daily time frame, price action is in a falling wedge (magenta). Presently, price action is sideways, but the general technical mode is bearish. Bears seized the initiative on Thursday after price action got to the wedge resistance trendline. The bearish inverted hammer-like candlestick printed on Friday technically portends a bearish continuation.
Attached Image (click to enlarge)
I may be wrong. Trade safe and prosper.
KP
Do your homework, follow the footprints of smart money