EURUSD Weekly Technical Outlook
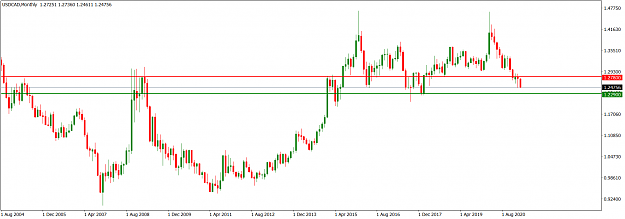
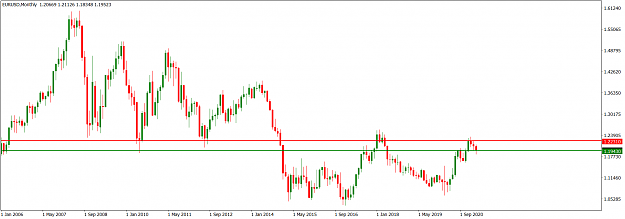
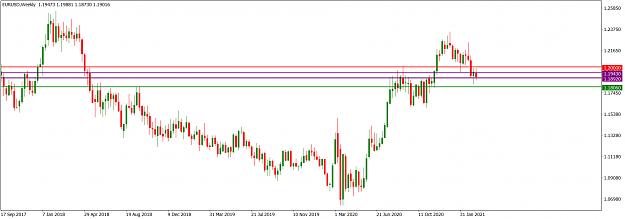
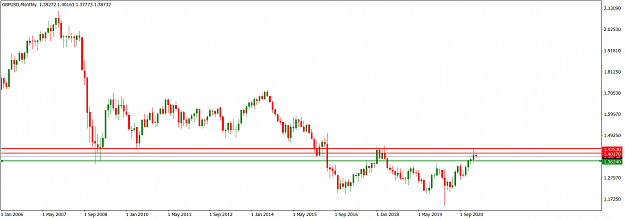
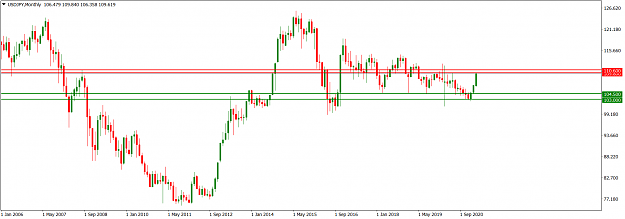
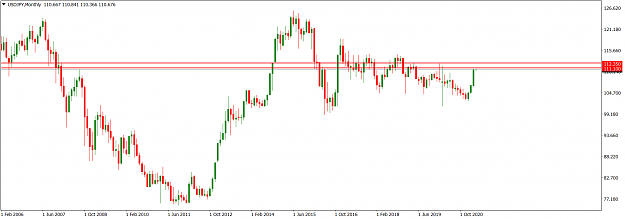
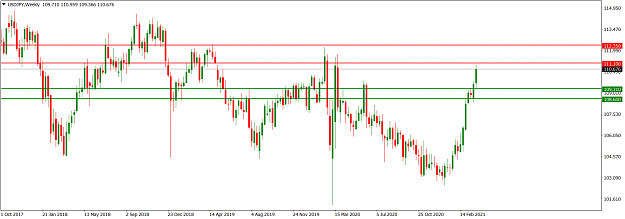
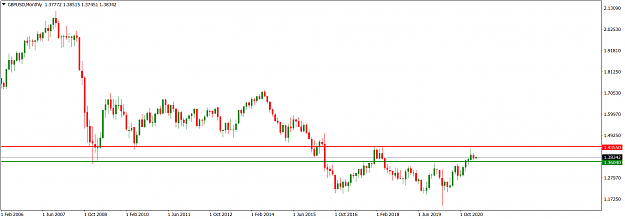
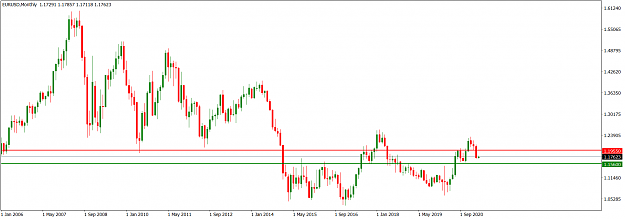
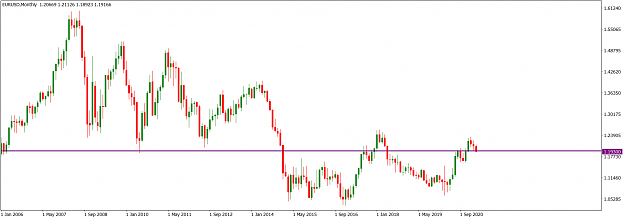
The EURUSD market operation is presently in a bearish mode. On the monthly time frame, the candlestick print in January rejected the 1.23000 multi-year horizontal resistance area. There was a bearish follow-up in February, although not significant; a situation indicating that bulls are still influential in the market. Nevertheless, the interim March market operation is in favour of bears. Meanwhile, market operation is located at the 1.19300 area (purple), which is a horizontal support area.
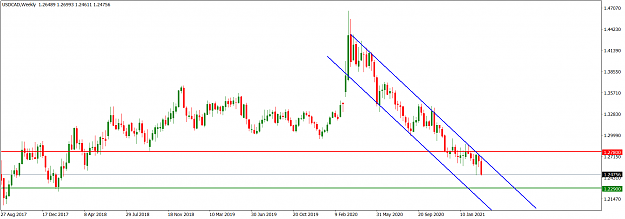
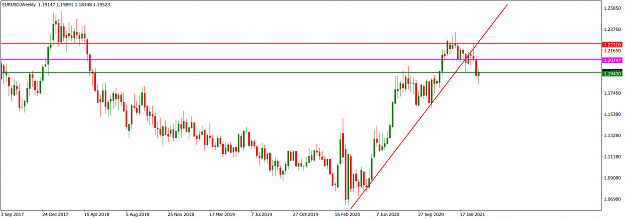
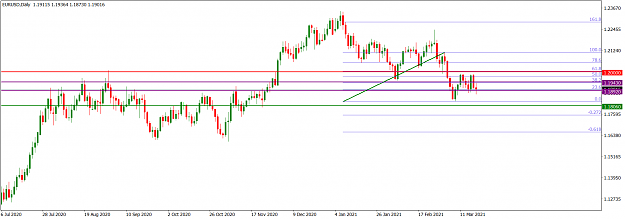
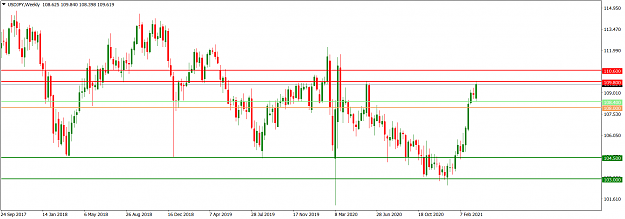
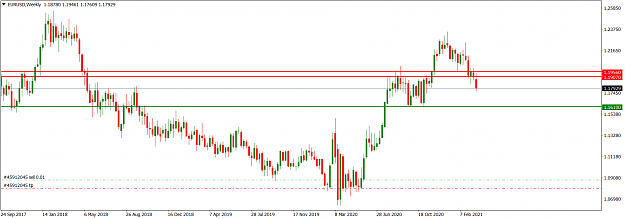
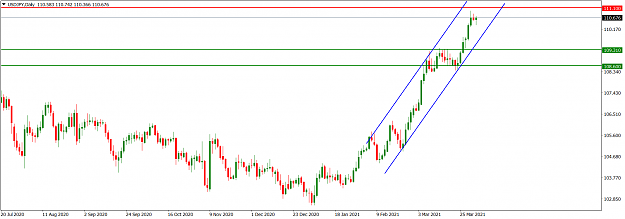
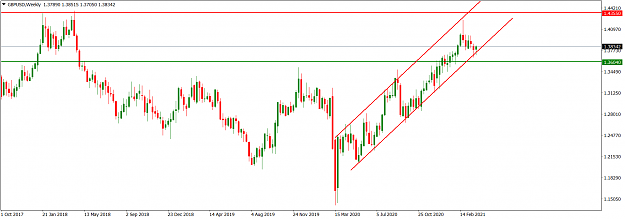
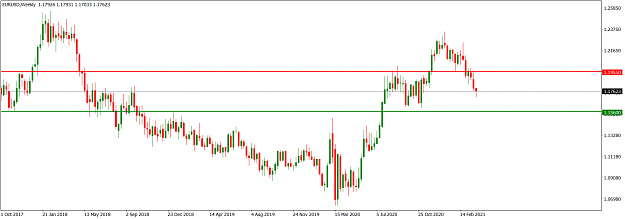
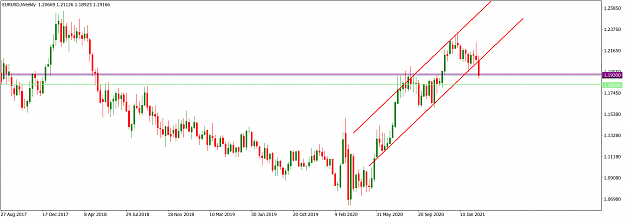
On the weekly time frame, last week, EURUSD market operation broke below a rising channel (red) with a relatively big bearish continuation candlestick. It is presently located at the 1.19300 horizontal support area (purple) seen on the monthly time frame. Technically, the area may see a bullish retracement to retest the broken-down channel support trendline or a bearish surge to the nearby horizontal support extension around 1.18300 (light green).
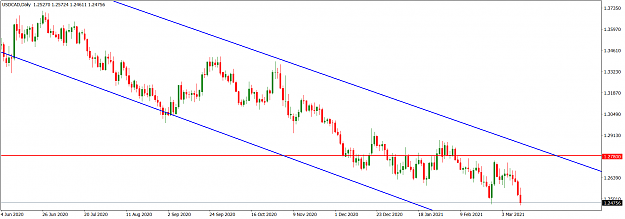
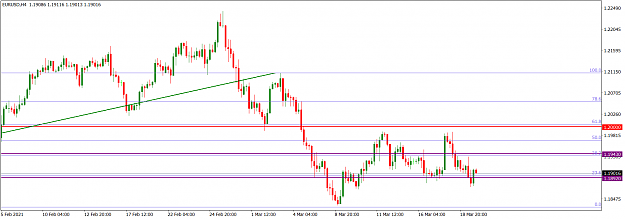
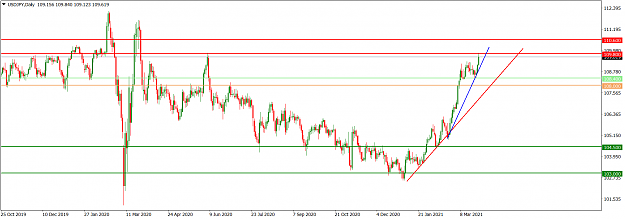
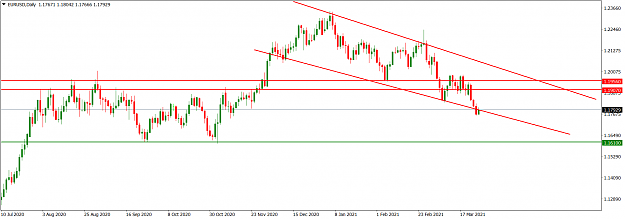
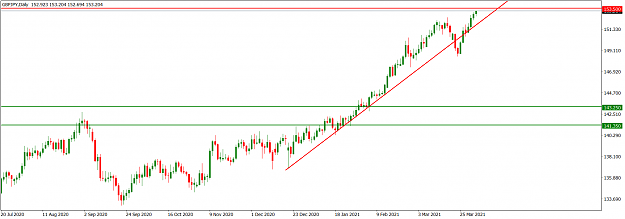
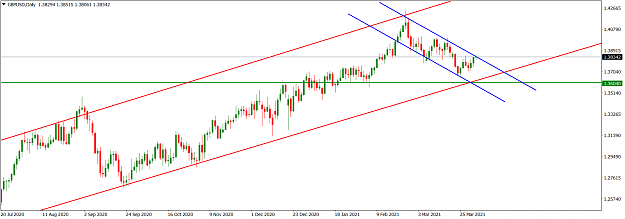
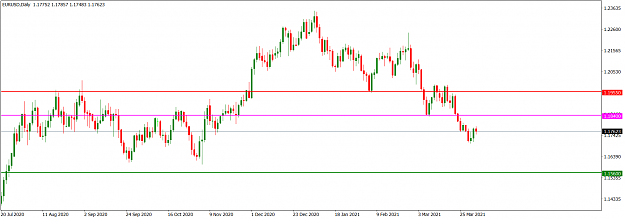
Price action on the daily time frame broke below a rising channel (red) with a bearish print on Friday. It is presently tackling the 1.19300 horizontal support area (purple) seen on the monthly time frame. The Friday bearish print that broke down the channel support trendline has its lower shadow a bit longer than its upper shadow; technically indicating bullish resistance at the 1.19300 horizontal support area (purple). We may see a retest of the breached channel support trendline in the early part of this week. Any further bearish drive will have to contend with the next horizontal support around 1.18300 (light green) before bears can pursue an ambition to expose the 1.16200 handle (sandybrown).

I may be wrong. Trade safe and prosper.
KP
The EURUSD market operation is presently in a bearish mode. On the monthly time frame, the candlestick print in January rejected the 1.23000 multi-year horizontal resistance area. There was a bearish follow-up in February, although not significant; a situation indicating that bulls are still influential in the market. Nevertheless, the interim March market operation is in favour of bears. Meanwhile, market operation is located at the 1.19300 area (purple), which is a horizontal support area.
Attached Image (click to enlarge)
On the weekly time frame, last week, EURUSD market operation broke below a rising channel (red) with a relatively big bearish continuation candlestick. It is presently located at the 1.19300 horizontal support area (purple) seen on the monthly time frame. Technically, the area may see a bullish retracement to retest the broken-down channel support trendline or a bearish surge to the nearby horizontal support extension around 1.18300 (light green).
Attached Image (click to enlarge)
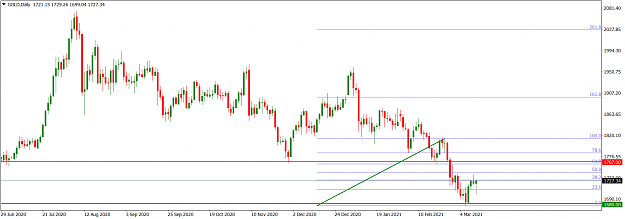
Price action on the daily time frame broke below a rising channel (red) with a bearish print on Friday. It is presently tackling the 1.19300 horizontal support area (purple) seen on the monthly time frame. The Friday bearish print that broke down the channel support trendline has its lower shadow a bit longer than its upper shadow; technically indicating bullish resistance at the 1.19300 horizontal support area (purple). We may see a retest of the breached channel support trendline in the early part of this week. Any further bearish drive will have to contend with the next horizontal support around 1.18300 (light green) before bears can pursue an ambition to expose the 1.16200 handle (sandybrown).
Attached Image (click to enlarge)
I may be wrong. Trade safe and prosper.
KP
Do your homework, follow the footprints of smart money
1