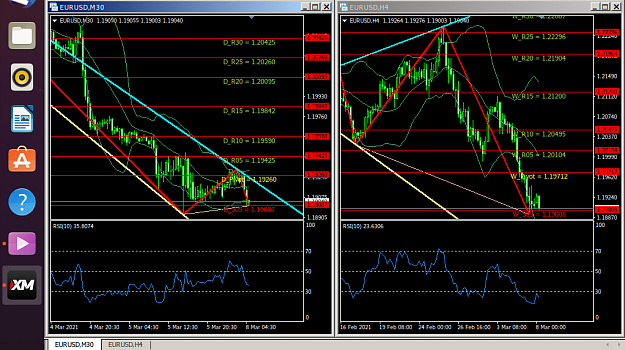
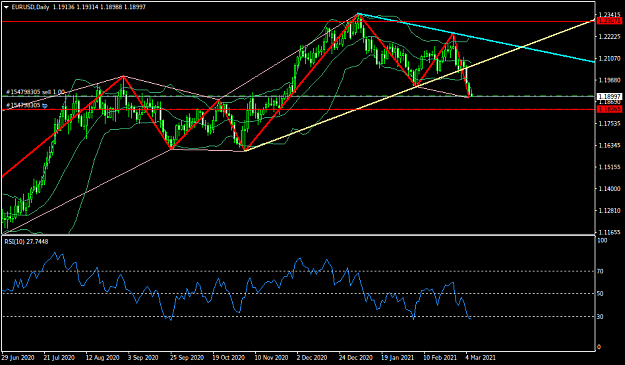
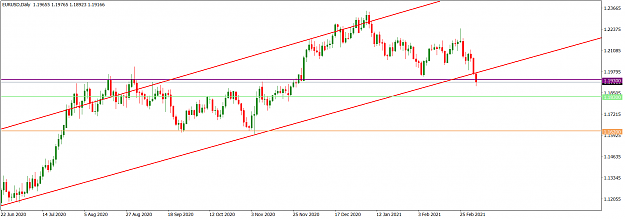
Here's my take on the EURUSD, from the technical perspective of a swing trader. Price action on the daily time frame broke below a rising channel (red) with a bearish print on Friday. It is presently tackling the 1.19300 horizontal support area (purple) seen on the monthly time frame. The Friday bearish print that broke down the channel support trendline has its lower shadow a bit longer than its upper shadow; technically indicating bullish resistance at the 1.19300 horizontal support area (purple). We may see a retest of the breached channel support trendline in the early part of this week. Any further bearish drive will have to contend with the next horizontal support around 1.18300 (light green) before bears can pursue an ambition to expose the 1.16200 handle (sandybrown).
I may be wrong. Trade safe and prosper.
KP
I may be wrong. Trade safe and prosper.
KP
Attached Image (click to enlarge)
Do your homework, follow the footprints of smart money
2