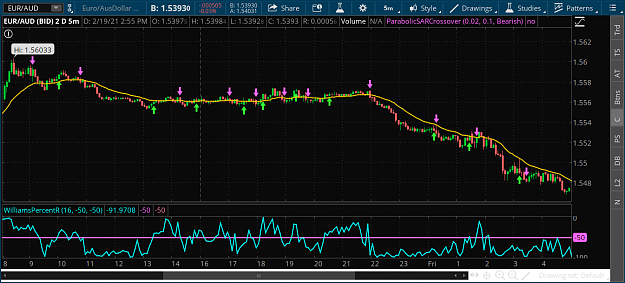
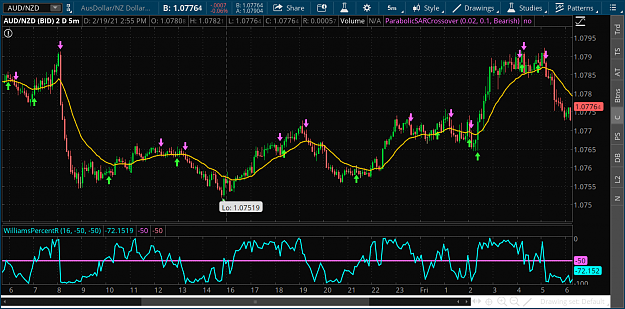
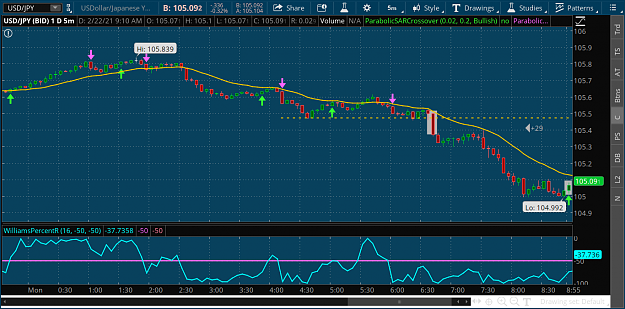
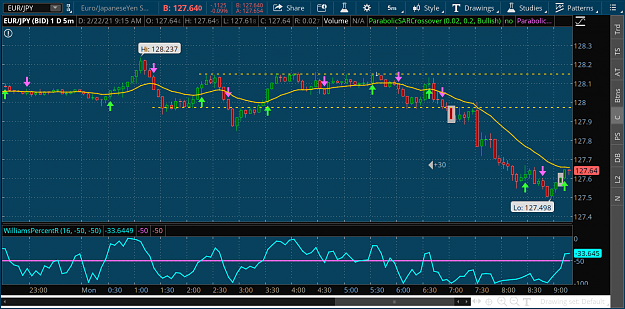
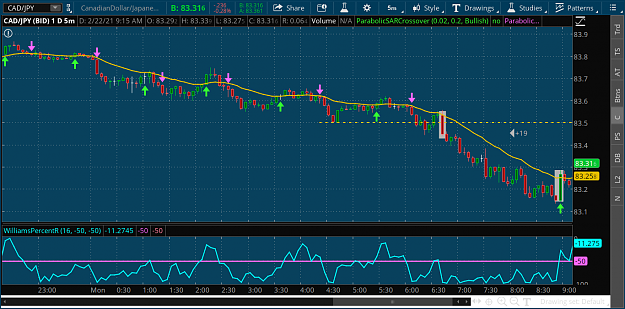
No I do not use top 5 currency pairs don't even glance at it, though they may end up among pairs I trade. My primary objective is to find strength/weakness that the charts that have pa I find to my liking.
1
M candles / Custom candles for second charts 1 reply
Consecutive Candles Williams %R and Volume with 55EMA Baseline 788 replies
No candles on 15 minute charts 5 replies
Calculating only buy candles vs sell candles 2 replies
15 Minute MA+SAR trading strategy 19 replies
DislikedWound up doing a little trading this morning started a little before 6:15. Took 3 JPY pair trades U/J, Cad/J and E/J. Passed on 2 that would've made money but didn't like PA felt a little too jumpy for my tastes G/J and N/J. A/J never in the picture, {image} {image} {image}Ignored
DislikedWell yes I do have losses every week, on options, index futures, oil futures, but I almost never let my trades hit my stop loss, I get a fair amount of B/E ttrades and I stay away from very volatile looking charts. Lots of people think you need volatility for profitable trades, Not me I like charts to look consistent not jumpy. Not filled with big candles/big wicks. Hell I don't even like trending charts that are loaded with big candles/wicks, for me placid looking charts are easier to trade. Plus much easier on the psyche, which in turn makes decision...Ignored
DislikedWell then it looks to me like a classic over trading problem, fear itself is not your problem its greed you're afraid you are going to miss an opportunity. First you need to understand you are not and never will be profitable if you can't learn to stop over trading. Second I would strongly recommend you go back to Demo trading until you learn to trade 1 system profficiently. Whats more important just trading or trading profitably, if its the former you are screwed. There is no success in trading without discipline and from your description this...Ignored
Disliked1) kind of a jumpy chart 2)Trying to join trend that's already a few hours old which is a long time in day trading. 3) look at the charts I trade do they ever look like this?Ignored