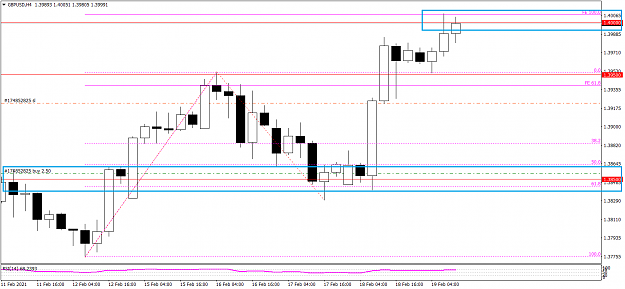
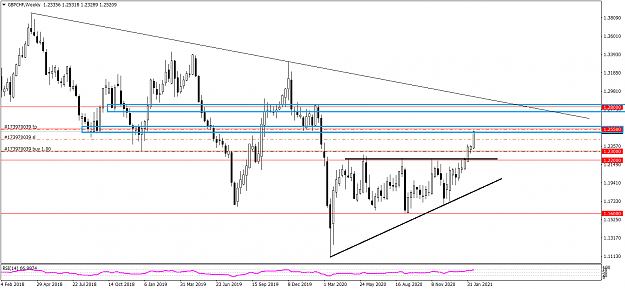
GBPUSD 1.3850 long trade. The confluence of 0.5RN and Fib 61 worked well, just a little patience was needed. The target is 1.40 (ab=cd, FE 100). {image}
Ignored
GBPUSD 1.3850 long trade reached its target @ 1.40 (ab=cd, FE 100).
{quote} This is just based on TA. People say TA doesn't work, but the truth is they do not study it well or they don't know how to apply it properly.
Ignored
You are very right, but every one is not that good in Technical analysis (i just googled TA) hope it is the same thats how noob i am, but it is great to see you juicy trades, please take some time out as per your convenience with regards how to monitor so many pairs at once.
which time frames are best to apply fibs, as you see multiple fibs on charts.
i may be asking too much but i love your trades and you are the best trader i have seen so far, not buttering but an honest opinion.
because you trade:
reversals, continuations, breakouts of horizontal and trend lines, fib and round nos, waves and what not. Great !
{quote} You are very right, but every one is not that good in Technical analysis (i just googled TA) hope it is the same thats how noob i am, but it is great to see you juicy trades, please take some time out as per your convenience with regards how to monitor so many pairs at once. which time frames are best to apply fibs, as you see multiple fibs on charts. i may be asking too much but i love your trades and you are the best trader i have seen so far, not buttering but an honest opinion. because you trade: reversals, continuations, breakouts...
Ignored
.........i agree bilal ...... we need a great teacher ..........
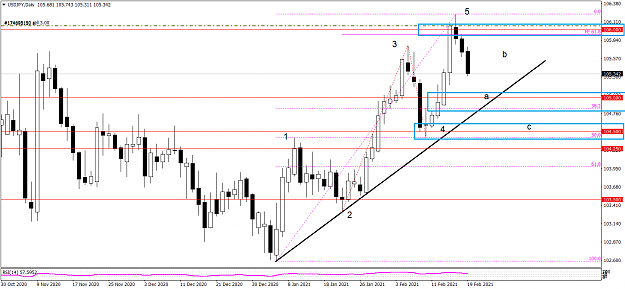
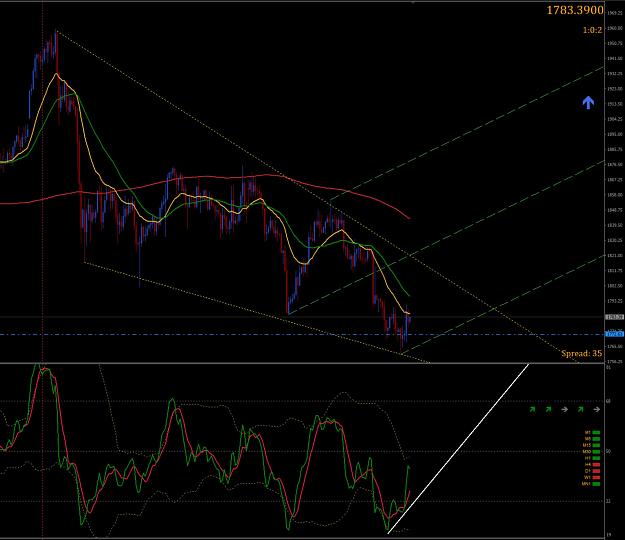
Gold, if S @ 1765/50 holds, this can turn into a very bullish pattern (a combination of flag/triangle and a possible double bottom). {image}
Ignored
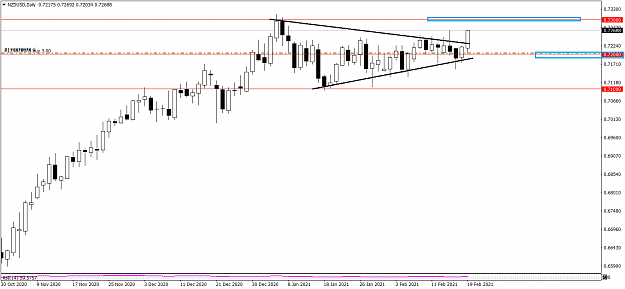
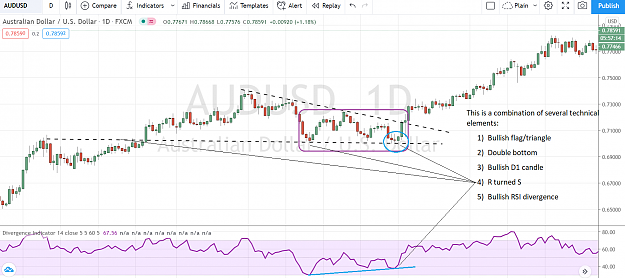
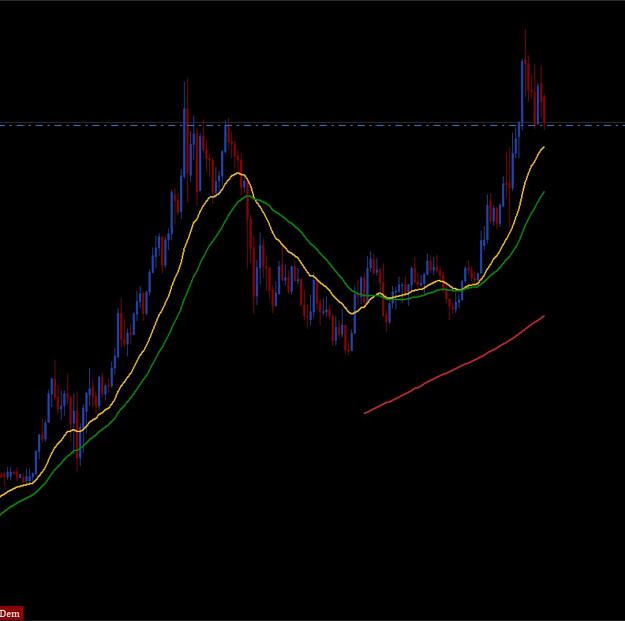
AUDUSD, this is a chart example of what I call "candle on the level with divergence (CLD)" setup nested in a combo of flag/double bottom pattern. The gold chart shows a similar formation without a weekly divergence.
PS. I forgot to add RN 0.70 to that chart. That was another reason that level was significant.
{quote} Nice trades mrhb30jr. It would be more helpful if you could post some of the trade ideas or analysis in advance.
Ignored
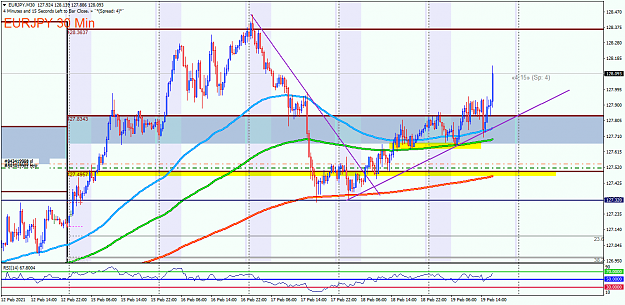
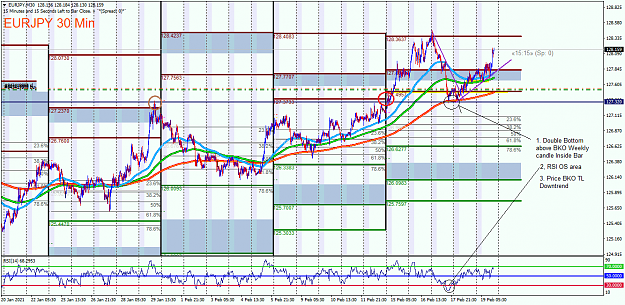
Hi Shahab8b,....
Here is my point
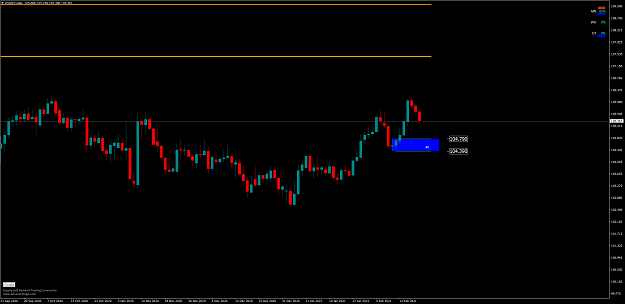
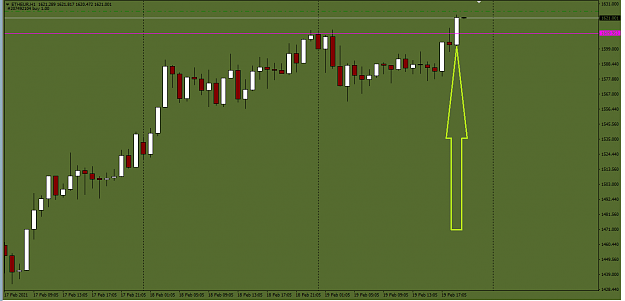
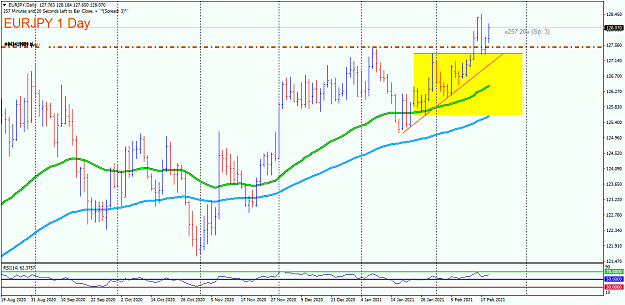
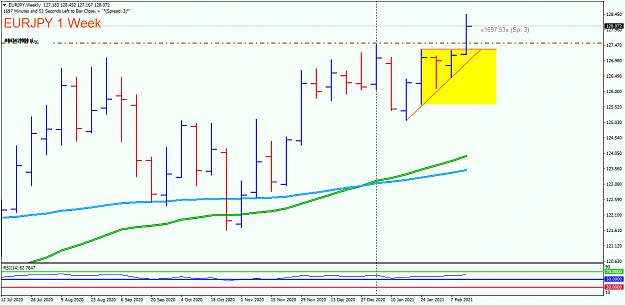
1. Weekly TF 2 inside Bars and price has been break the high of mother bar
2. Price pullback to the previous BKO and confirm by double bottom M30 Time frame chart at that area, if the weekly candle close above this area we will see more higher the EJ
3. while the double bottom on M30 area and RSI M30 oversold level ..
{quote} You are very right, but every one is not that good in Technical analysis (i just googled TA) hope it is the same thats how noob i am, but it is great to see you juicy trades, please take some time out as per your convenience with regards how to monitor so many pairs at once. which time frames are best to apply fibs, as you see multiple fibs on charts. i may be asking too much but i love your trades and you are the best trader i have seen so far, not buttering but an honest opinion. because you trade: reversals, continuations, breakouts...
Ignored
Thanks bilal1947.
To answer your question, the FX pairs move in harmony, you basically trade the USD trend. Of course, GBP and JPY do their own thing sometimes. But you can put the majors into four groups: 1) EU and UCHF, 2) AU, NU, and UCAD, 3) GU, and 4) UJ. So I only need to look at 4 charts. Most of the time they arrive at their setup levels at the same time. As for crosses, I only trade major confluence levels so they do not require intensive analysis.
Regarding Fibs, you can apply them to any time frames. I like H4 and D1. But I have posted examples that I used them on M1 and M5 charts for scalping.
Joined Jul 2009
|
Status: The Alchemist
|8,917 Posts
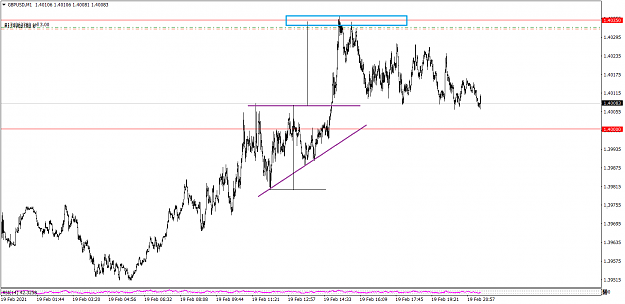
GBPUSD short trade. I took this trade based on the triangle measurement. Considering the wave structure, I was suspecting that the wave from 1.3830 would end up around 1.40 ish. GU is still bullish. So we have to wait and see how this will play out next week.
{quote} Thanks bilal1947. To answer your question, the FX pairs move in harmony, you basically trade the USD trend. Of course, GBP and JPY do their own thing sometimes. But you can put the majors into four groups: 1) EU and UCHF, 2) AU, NU, and UCAD, 3) GU, and 4) UJ. So I only need to look at 4 charts. Most of the time they arrive at their setup levels at the same time. As for crosses, I only trade major confluence levels so they do not require intensive analysis. Regarding Fibs, you can apply them to any time frames. I like H4 and D1. But I have...
Ignored
thank you dear shahab for taking time to share your valuable inputs, i will practise to observe USD pairs in the same order.
{quote} AUDUSD, this is a chart example of what I call "candle on the level with divergence (CLD)" setup nested in a combo of flag/double bottom pattern. The gold chart shows a similar formation without a weekly divergence. PS. I forgot to add RN 0.70 to that chart. That was another reason that level was significant. {image}
Ignored
Great example, Shahab. Thanks.
I have noticed that Gold practically never shows divergence on Daily or Weekly charts. It moves too quickly for that. It doesn´t stick around a swing top or bottom to give time for a divergence to form. I call it a Psychedelic pair.
On the other hand, H4 is another matter. Gold practically always paints a divergence in H4. There is a clear H4 divergence on the current Gold Chart. On top of that, we have broken out of a perfect 8 year monthly saucer formation and tested the top of it from the other side. It all adds up to a strong possibility of a bottom here and movement to new highs. How high? The depth of the saucer indicates a target of 2500 but I believe it will go much higher.
It makes sense fundamentally also:
1- USD is in a down cycle. The twin deficits and Fed and Fiscal expansive policies almost guarantee it will continue.
2- Inflation is clearly on the way back. Check out the US 10 Year bond rates.
3- Alternate investments like real estate, crypto and commodities are strongly higher, including Gold´s cousin, Silver.
4- The stock market has rocketed higher to ridiculous levels.
Gold has been the laggard here for no real reason. It could very well be the next star to brightly shine.