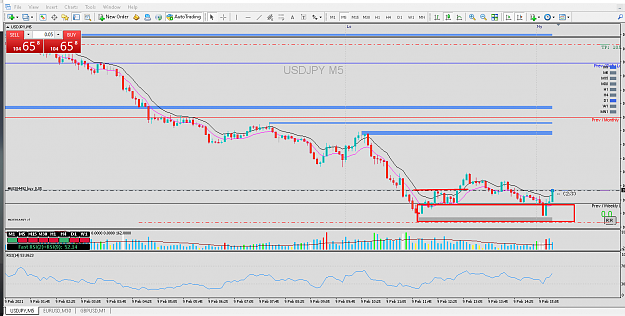
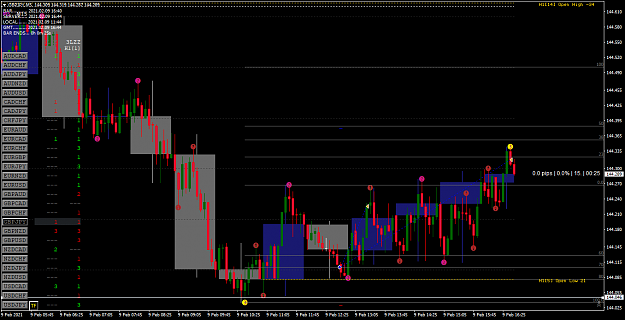
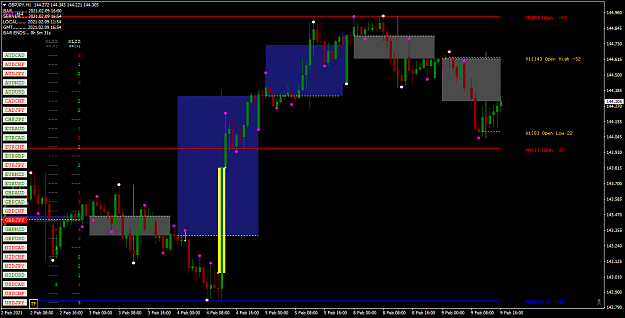
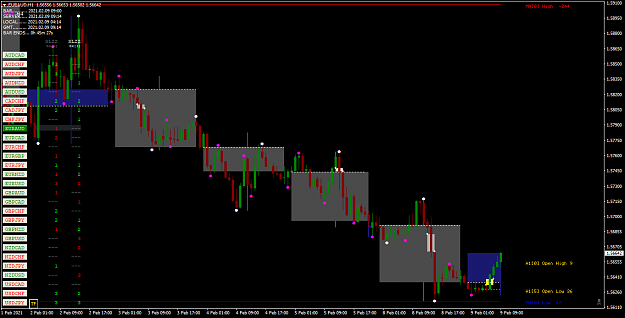
1hr chart with the Daily candles. There are multiple things I take into consideration when placing trades. What I saw last night before I entered was 4 consecutive days of selling. Scroll back on your chart and check the statistics on that. I learned that from another trader and it’s just something simple you can do. EURAUD made a new monthly/yearly low, makes a higher high, then price returns to the order block. What you’re going to see on the daily timeframe is exactly what you see now same type of structure. Also from yesterday’s sell off Banks decided to go into DD around the open and they left an imbalance up there that just got filled. There’s a bigger picture and seeing that makes your lower timeframe entries simple.
Attached Image (click to enlarge)
2