GBPUSD Weekly Technical Outlook
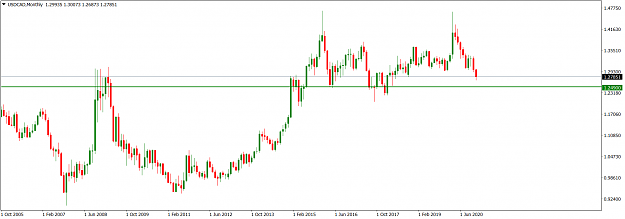
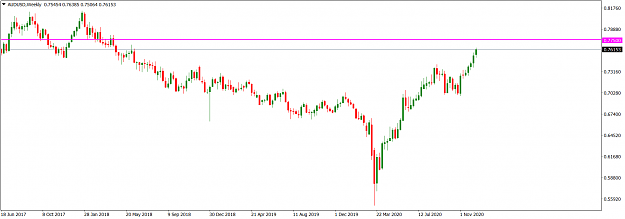
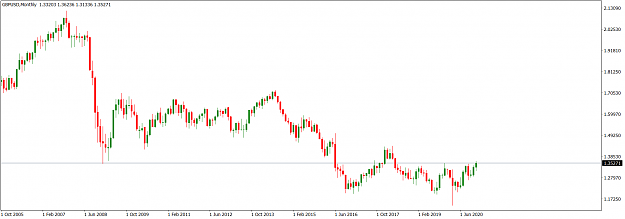
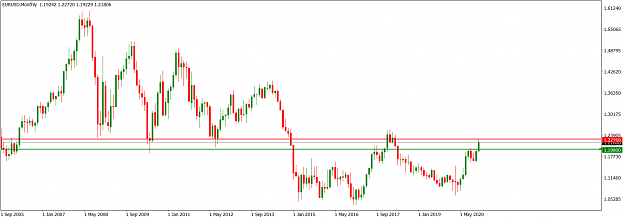
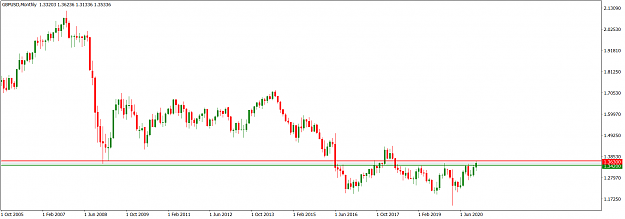
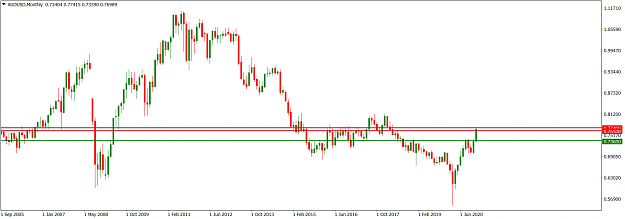
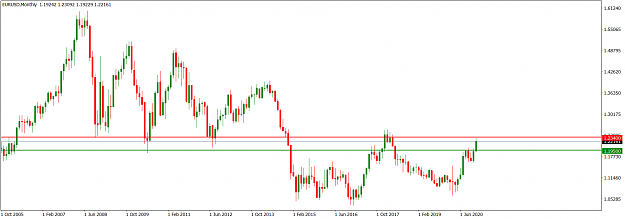
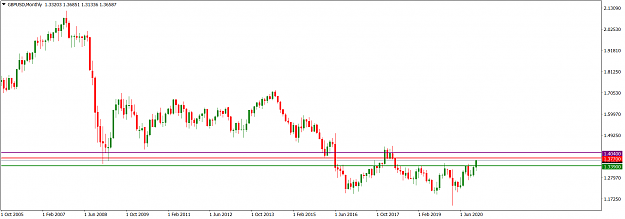
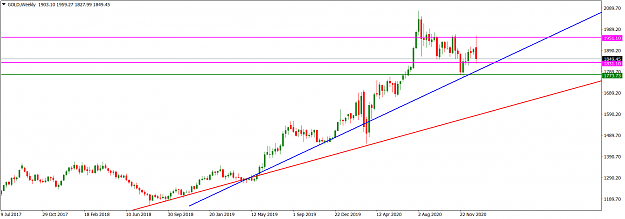
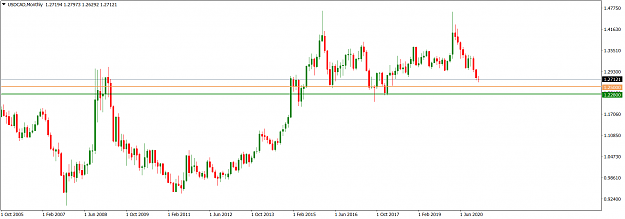
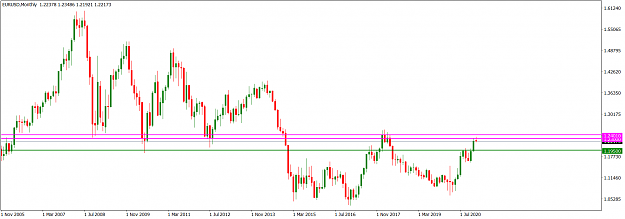
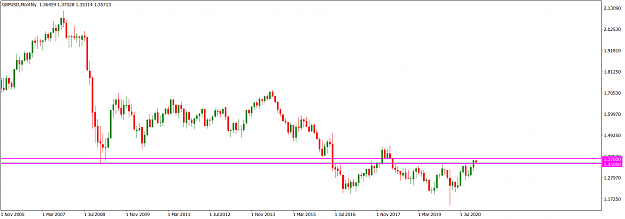
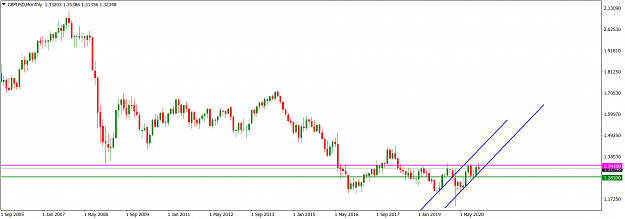
The 1.34100 area (magenta) has been acting as technical horizontal resistance for GBPUSD market operation on the monthly time frame since June 2018. The interim December candlestick print is presently below the area, meaning that it is still the prevailing horizontal resistance and technically favours bears. Presently, market operation is within a rising channel (blue). The 1.28300 area (green) is the prevailing horizontal support on the monthly time frame.
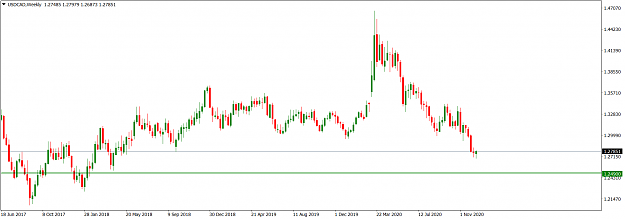
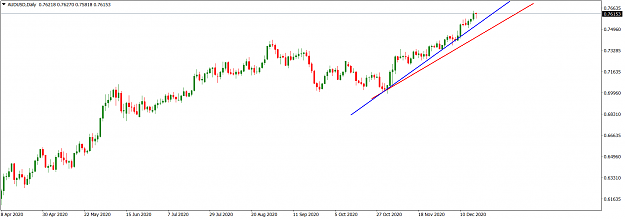
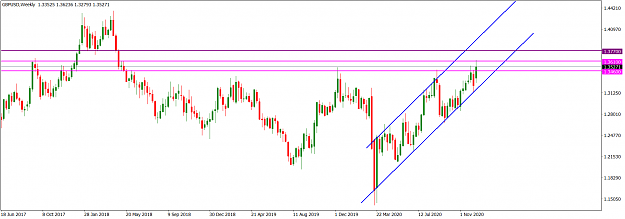
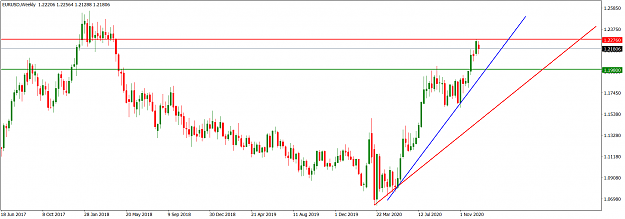
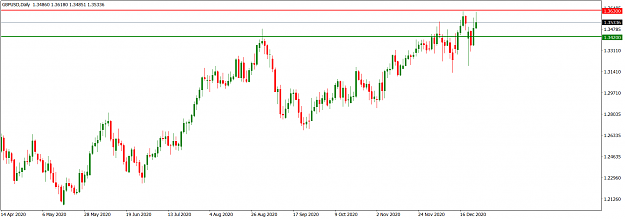
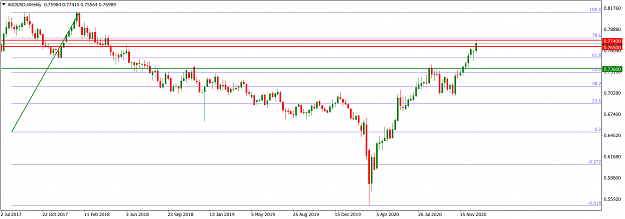
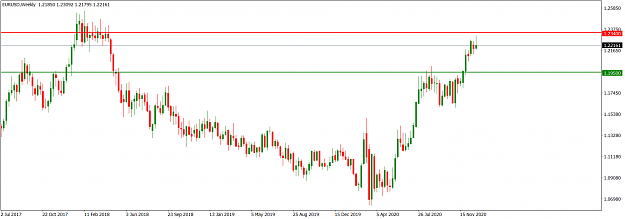
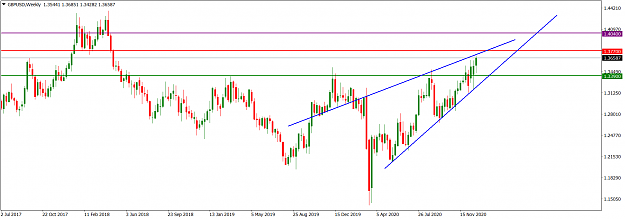
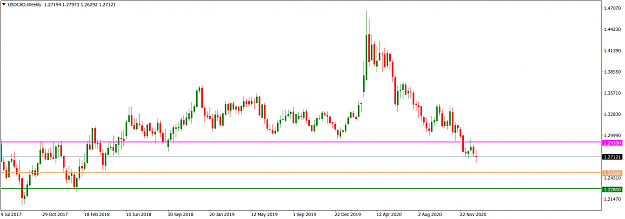
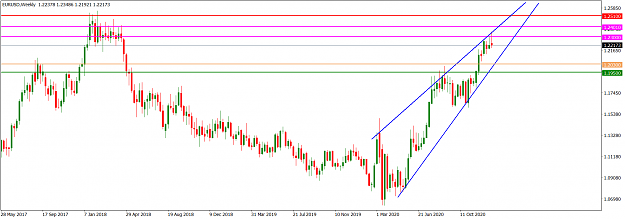
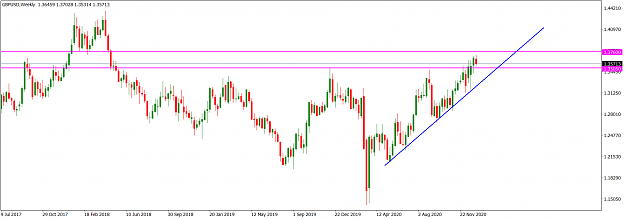
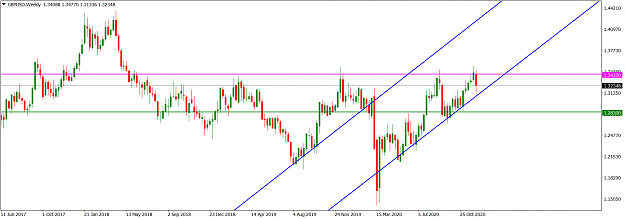
On the GBPUSD weekly time frame, there is a bearish rejection of the 1.34100 horizontal resistance area (magenta). Last week, a bearish rejection candlestick broke below the bullish candlestick printed two weeks ago. However, it printed a long lower tail as it gets near the support trendline of the rising channel (blue) seen on the monthly time frame. It will take a more influential bearish attempt this week to sustain a southward drive.
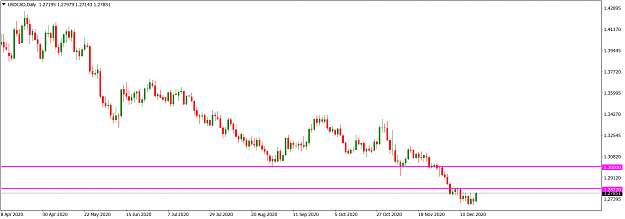
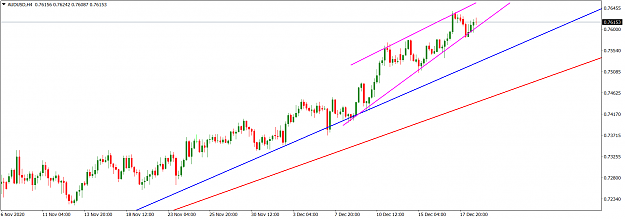
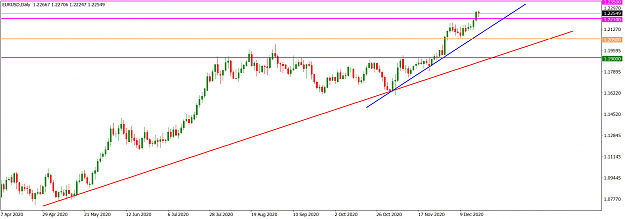
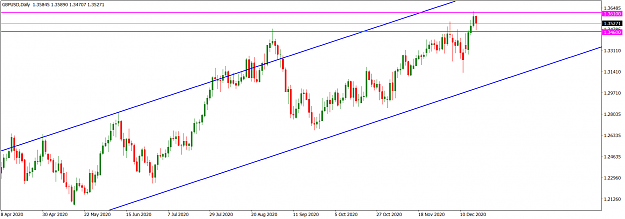
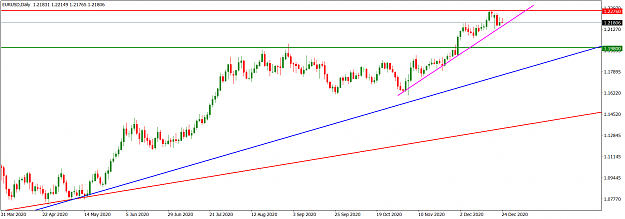
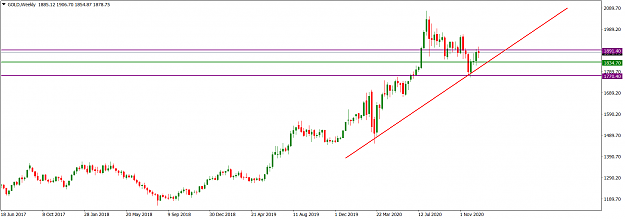
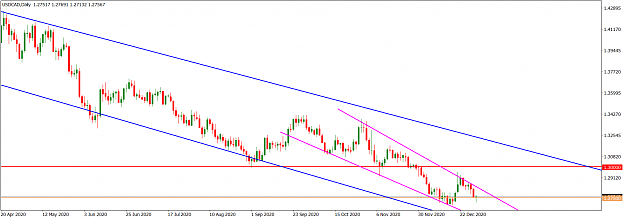
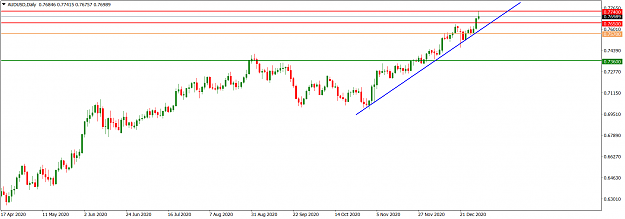
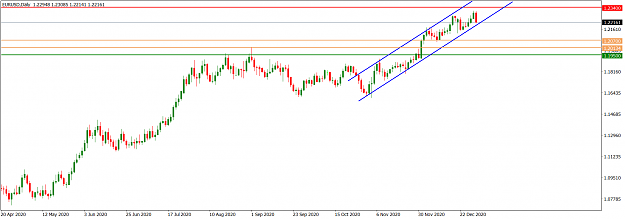
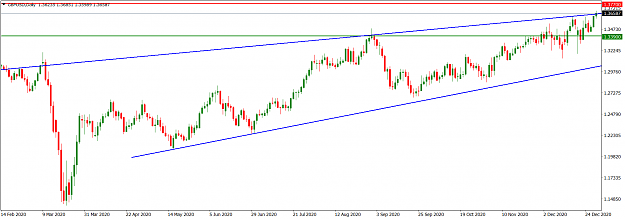
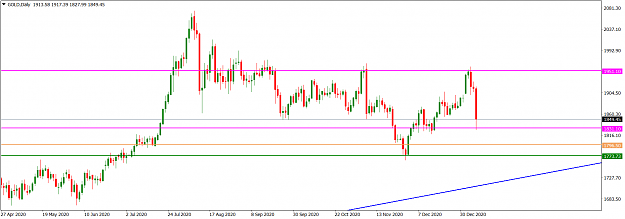
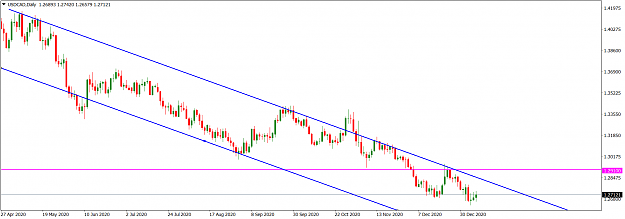
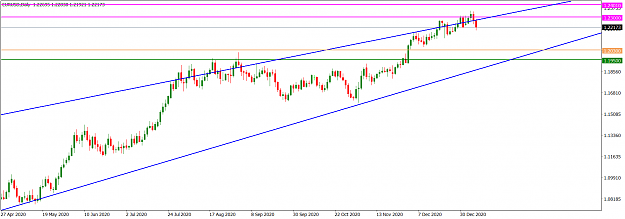
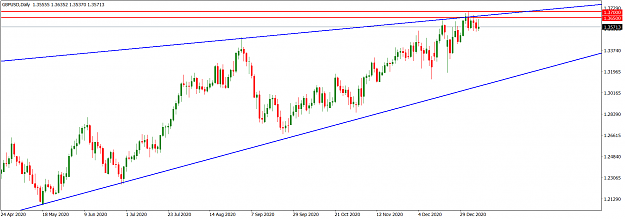
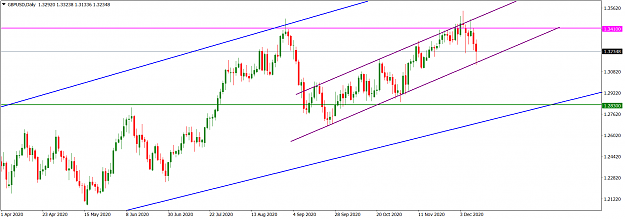
Price action on the daily time frame is operating within an inner rising channel (purple) in the context of a bigger rising channel (blue), seen on the weekly time frame. Presently, price action is disposed negatively within the inner rising channel. The bearish candlestick printed last week Friday pierced the channel support trendline before retracing a bit northward. Nevertheless, recent technical impulse favours bears and we may see a bearish continuation. A significant breakdown of the channel support trendline may see bears target the horizontal support around the 1.28300 area (green). As a swing trader, I am more bearish GBPUSD than bullish but I will await the daily close on Monday before making any directional decision.
I may be wrong. Trade safe and prosper.
KP
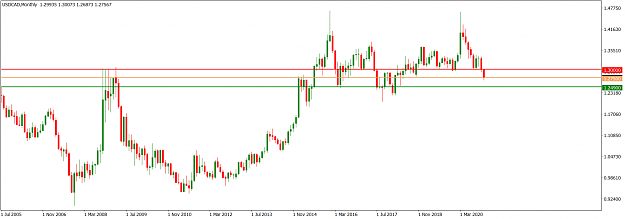
The 1.34100 area (magenta) has been acting as technical horizontal resistance for GBPUSD market operation on the monthly time frame since June 2018. The interim December candlestick print is presently below the area, meaning that it is still the prevailing horizontal resistance and technically favours bears. Presently, market operation is within a rising channel (blue). The 1.28300 area (green) is the prevailing horizontal support on the monthly time frame.
Attached Image (click to enlarge)
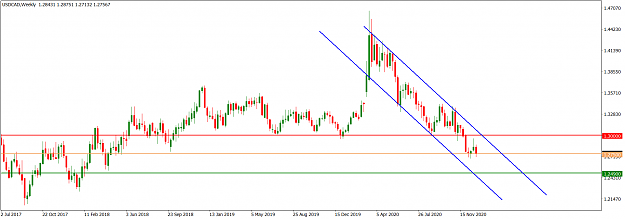
On the GBPUSD weekly time frame, there is a bearish rejection of the 1.34100 horizontal resistance area (magenta). Last week, a bearish rejection candlestick broke below the bullish candlestick printed two weeks ago. However, it printed a long lower tail as it gets near the support trendline of the rising channel (blue) seen on the monthly time frame. It will take a more influential bearish attempt this week to sustain a southward drive.
Attached Image (click to enlarge)
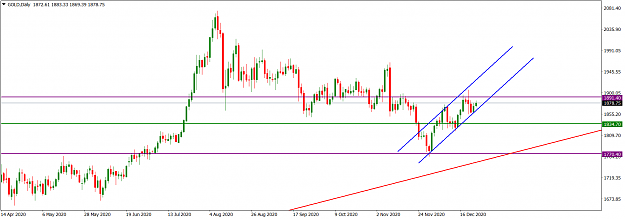
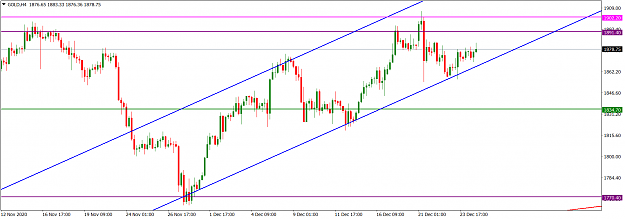
Price action on the daily time frame is operating within an inner rising channel (purple) in the context of a bigger rising channel (blue), seen on the weekly time frame. Presently, price action is disposed negatively within the inner rising channel. The bearish candlestick printed last week Friday pierced the channel support trendline before retracing a bit northward. Nevertheless, recent technical impulse favours bears and we may see a bearish continuation. A significant breakdown of the channel support trendline may see bears target the horizontal support around the 1.28300 area (green). As a swing trader, I am more bearish GBPUSD than bullish but I will await the daily close on Monday before making any directional decision.
Attached Image (click to enlarge)
I may be wrong. Trade safe and prosper.
KP
Do your homework, follow the footprints of smart money