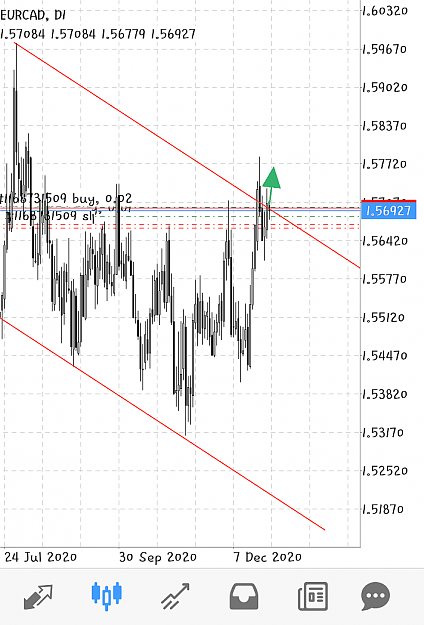
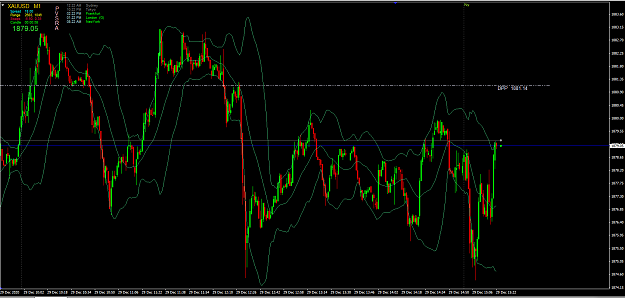
Disliked{quote}Small support and bang up she goes. It is easy to see those support/resistance lines and consolidation aswell. Look at price line and check how many bars "bounce" against price for support/resistance and how many candles(bars) price cut in "half" for consolidation. {image} Little Resistance? {image}
Ignored
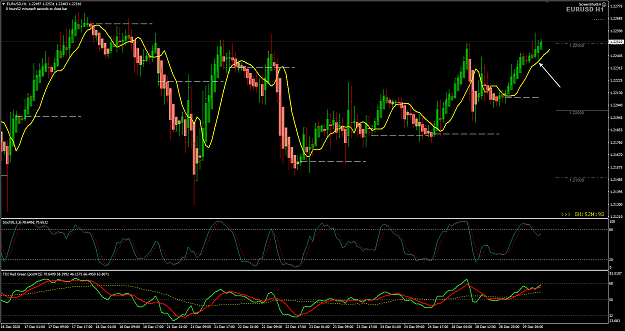
Attached Image (click to enlarge)
@Tekkies
Keep It Simple: Follow what Big E posted in this thread and also his old thread.
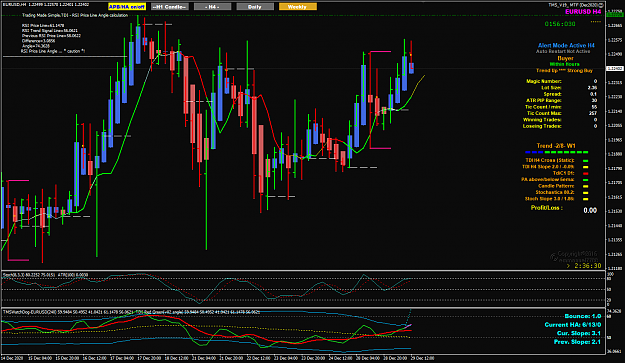
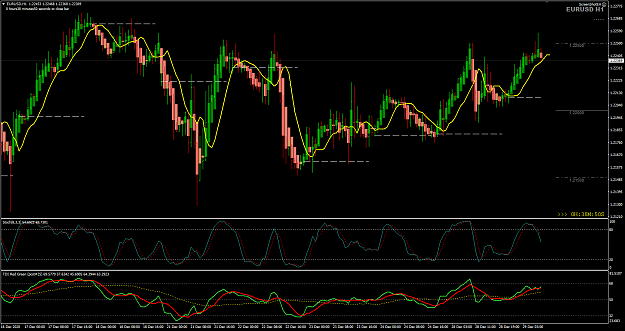
5EMA,Typical Price, Shift+2 is what another member shared with him. And he see that as direction of the price action and also when the 5EMA show confluence with 10EMA, Close, there is PA bounce .
Today is a good example why you should follow Big E and use his chart template.
Attached Image (click to enlarge)
Honesty is a very expensive gift. You wont find it in cheap people.WBuffett
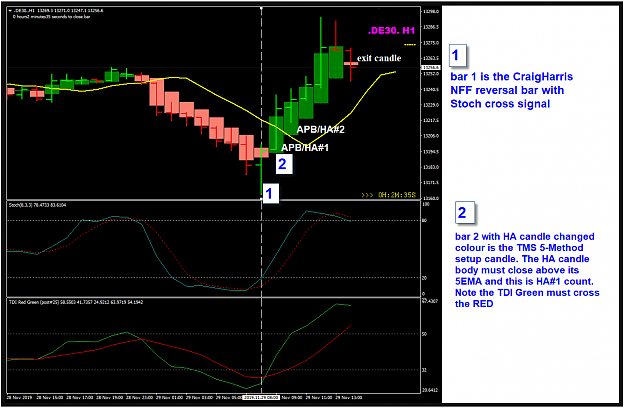
1