better place,i use this method and happy with it,thanks Emmanual for being part of this thread too,i suggest u not to waste your time and energy there,its an old method.
better place,i use this method and happy with it,thanks Emmanual for being part of this thread too,i suggest u not to waste your time and energy there,its an old method.
Ignored
So far so good and we do not have trolls who will spread hatred in this thread. RH will eliminate them quickly enough.
Trading RobinHood' TMS(r) is much simpler that Big E' TMS.
I think TMS(r) is conservative and Big E' TMS reversal entries on APB#1 and APB#2 is far too aggressive and can lead to losses which can be cause traders a lot of stress.
TMS(r) being conservative will generate enough trades per month when we have more pairs in our watchlist and will help us achieve our financial goal. Trading the Daily is the better way to go. H4 will generate some shorter term trades per week. It all depends on the market type conditions we choose to trade in.
Honesty is a very expensive gift. You wont find it in cheap people.WBuffett
To be honest, we have not fully explored Tms (r) # 1. Up to now, when I have been sticking to this method for 1 year and then mastered the 2 input methods of Robinhood, cross and continuation, but carefully reading page#1 on this topic, there are still many other methods such as divergence, convergence ... but RobinHood has mentioned. Actually I am still learning, continue to honing day by day. As the simplest RSI indicator that RobinHood said, it crossed over 50, but the RSI still converged and the divergence also identified a strong support level,trend break.... Thanks RobinHood, Thanks Emmanuel8899 and everyone on this topic. There is a lot more to be learned from RobinHood
To be honest, we have not fully explored Tms (r) # 1. Up to now, when I have been sticking to this method for 1 year and then mastered the 2 input methods of Robinhood, cross and continuation, but carefully reading page#1 on this topic, there are still many other methods such as divergence, convergence ... but RobinHood has mentioned. Actually I am still learning, continue to honing day by day. As the simplest RSI indicator that RobinHood said, it crossed over 50, but the RSI still converged and the divergence also identified a strong support level....
Ignored
You make money along the way while you are learning, that is the good thing about learning to trade the markets.
Some people pay money to learn. Some paid enough money then they start getting paid while still learning.
But some people will never get paid in their entire lifetime trading the markets, that's the hard truth.
What is the secret? There is no secret. It is simply very hard business to be in.
Honesty is a very expensive gift. You wont find it in cheap people.WBuffett
{quote} You make money along the way while you are learning, that is the good thing about learning to trade the markets. Some people pay money to learn. Some paid enough money then they start getting paid while still learning. But some people will never get paid in their entire lifetime trading the markets, that's the hard truth. What is the secret? There is no secret. It is simply very hard business to be in.
Ignored
That's right, Emma! To make money in the market is very difficult but with this topic, 2 ways of RobinHood will help people make money as well as at the simplest level that anyone can apply. Besides, after mastering it, we can develop more methods, for example, many people add MACD to confirm, such as someone using round numbers, pivot point or like you analyze WTDA and apply WCC but The way of import and export remains the same TMS (r) and the common ground they have made a profit. I am a newbie and after mastering the 2 TMS (r) methods now I learn to extend the problems around RSI and Stoch indicators to make cross trading more confident. Thank you I still have a long way to go
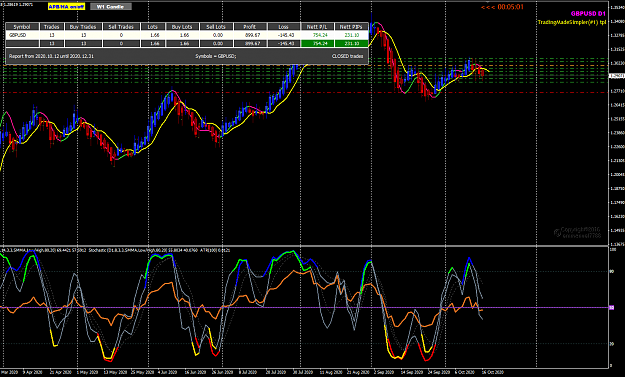
{quote} GBPUSD Oct 14 - basket closed and re-open a new basket.... {image}
Ignored
GBPUSD Oct 12 to 16 closed trades
- this is my best performing pair last week
- but I have an open basket and I need to manage on Monday to cut some losses .... and to balance my account and keep my equity healthy.
- closing oldest positions in the open basket and take some small losses
- Weekly is choppy now and a narrowing trading range below that of the ATR(52) weeks.
Attached Image (click to enlarge)
Honesty is a very expensive gift. You wont find it in cheap people.WBuffett
{quote} Hello Jonhathan There is no indicator for that Weekly High-Low . When you do your weekly top down analysis, you need to see the weekly bar/candle to see if that weekly is a Weekly Control Candle then you draw its high low manually. Weekly Control Candle WCC is a name give by member strat and those who follow his "THE PATH" will learn how to use this WCC. I use this WCC to determine the market type condition in which I do my swing trading. You need 3 weeks to be completed to confirm the WCC....
Ignored
here i would like to suggest to use WCPR,it give upper and lower levels of weekly ranges on 4h chart and i use previous and present 50% level line to break to take entries,its very useful for me.
im so glad to be here,i use a lot of trading conceots similar to this strategy,thanks All. {quote} here i would like to suggest to use WCPR,it give upper and lower levels of weekly ranges on 4h chart and i use previous and present 50% level line to break to take entries,its very useful for me.
Ignored
Hi T4Trade,Could you please share the WCPR? thanks
{quote} so the colour change from grey if it's overbought and oversold? sorry i'm only familiar with the default mt4 stochastic
Ignored
Overbought and oversold stochs are not considered for TMSr. Its the cross through the 50 line thats important along with RSI. Overbought/oversold stochs can keep going further up or down.
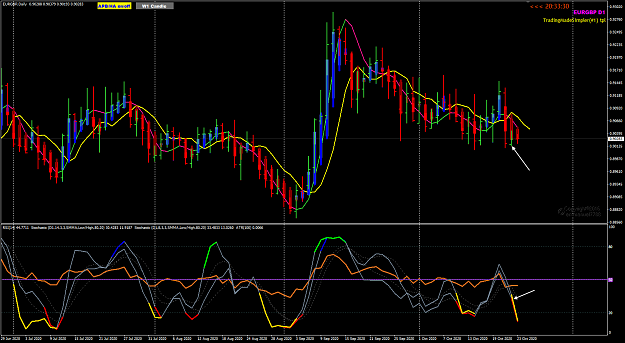
{quote} Overbought and oversold stochs are not considered for TMSr. Its the cross through the 50 line thats important along with RSI. Overbought/oversold stochs can keep going further up or down. {image}
Ignored
Hi NateBeruk
Alan is correct on how TMS(r) trades are taken at the crossover of the 50-level.
The change is the Stochastics show the change if the previous %K line and the current %K line and this occurs near and above the 80 and also near and below 20 levels.
What is important is when you have open positions you must pay attention when the K lines colour changes from gray to colour, observe if the price make higher high+higher Close or lower low +lower Close. Price can continue to move higher or lower in trending market conditions and when both the Stochastics are in their overbought and oversold levels, this is the behaviour of oscillators.
Example, look at your EURGBP Daily now and follow up.
Attached Image (click to enlarge)
Honesty is a very expensive gift. You wont find it in cheap people.WBuffett
{quote} so the colour change from grey if it's overbought and oversold? sorry i'm only familiar with the default mt4 stochastic
Ignored
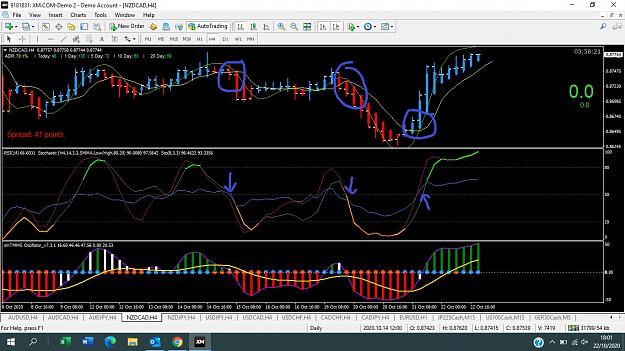
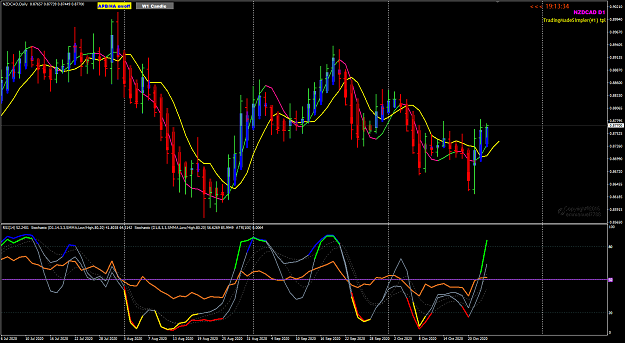
NZDCAD Oct 23 Daily
start stalking this pair
observe the Stoch(14,3,3) when it catches up with its cousin Stoch(8,3,3)
look at the price and the price action and what happens in the follow days / weeks ahead.
Attached Image (click to enlarge)
its too late to buy now... its too early to sell now ...
if you sell now, then you need to sell higher ... where do you place your initial Stop Loss and use that for Position Sizing? is this sell high, sell higher a good or bad idea?
Honesty is a very expensive gift. You wont find it in cheap people.WBuffett
its too late to buy now... its too early to sell now ... if you sell now, then you need to sell higher
Ignored
I think this pair is complete garbage on the Daily chart as there is no signs of buying or shorting. It's not too late to buy because there's no point in buying on the daily as the weekly doesn't confirm this. There's also no reason to sell now OR when its higher. H4 and H1 suggest looking for long opportunities NOW other than that I wouldn't do anything else with this pair.