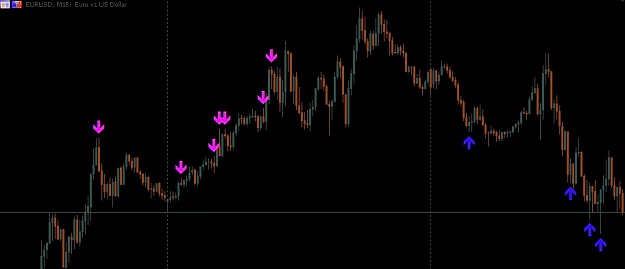
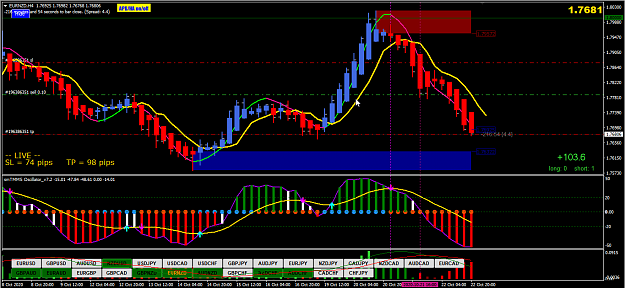
In the Trading view, I found this strategy, I don't know how this strategy work
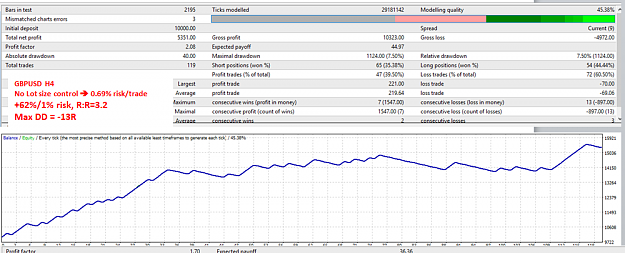
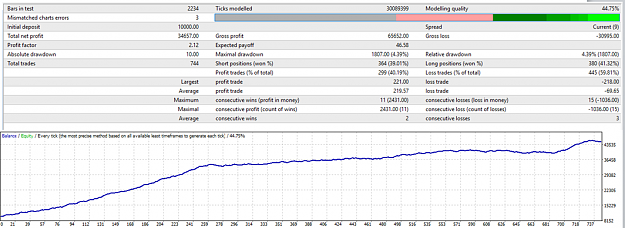
It is HA-based strategy, It is profitable with a Little big DD.
Here is the code-
//@version=2
strategy("Heikin-Ashi Strategy", overlay=true)
// Plots Color Of Heikin-Ashi Bars while Viewing Candlestics or Bars
//Works on Candlesticks and OHLC Bars - Does now work on Heikin-Ashi bars - But I have verified its accuracy
// Created By User ChrisMoody 1-30-2014 with help from Alex in Tech Support
// === BACKTEST RANGE ===
FromMonth = input(defval = 1, title = "From Month", minval = 1)
FromDay = input(defval = 1, title = "From Day", minval = 1)
FromYear = input(defval = 2017, title = "From Year", minval = 1998)
ToMonth = input(defval = 1, title = "To Month", minval = 1)
ToDay = input(defval = 1, title = "To Day", minval = 1)
ToYear = input(defval = 9999, title = "To Year", minval = 1998)
haclose = ((open + high + low + close)/4)//[smoothing]
haopen = na(haopen[1]) ? (open + close)/2 : (haopen[1] + haclose[1]) / 2
heikUpColor() => haclose > haopen
heikDownColor() => haclose <= haopen
barcolor(heikUpColor() ? aqua: heikDownColor() ? red : na)
if (heikUpColor() and (time > timestamp(FromYear, FromMonth, FromDay, 00, 00)) and (time < timestamp(ToYear, ToMonth, ToDay, 23, 59)))
strategy.entry("LONG", strategy.long, comment="LONG")
if (heikDownColor() and (time > timestamp(FromYear, FromMonth, FromDay, 00, 00)) and (time < timestamp(ToYear, ToMonth, ToDay, 23, 59)))
strategy.entry("SHORT", strategy.short, comment="SHORT")
//plot(pos, title="pos", style=line, linewidth=1, color=red )
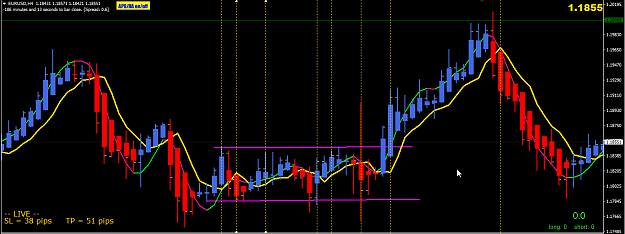
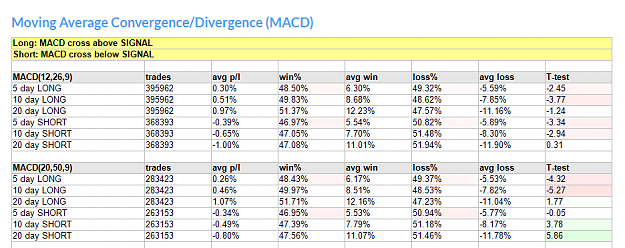
MA provides the market's current direction and strength.
1