• Home
  • Forums
  • Trades
  • News
  • Calendar
  • Market
  • Brokers
  • Login
  • Join
  • User/Email: Password:
  • 5:14pm
Menu
  • Forums
  • Trades
  • News
  • Calendar
  • Market
  • Brokers
  • Login
  • Join
  • 5:14pm
Sister Sites
  • Metals Mine
  • Energy EXCH
  • Crypto Craft

Options

Bookmark Thread

First Page First Unread Last Page Last Post

Print Thread

Similar Threads

I will code your scalping EAs for no charge 42 replies

I will code your pivot EAs for no charge 19 replies

Need help to code EAs for MT4 and MT5 4 replies

EAs and indicators relating to moutaki... 22 replies

InterbankFX has loaded its MT4 platform with custom EAs, indicators and scripts 1 reply

  • Platform Tech
  • /
  • Reply to Thread
  • Subscribe
  • 40,201
Attachments: I will code your EAs and Indicators for no charge
Exit Attachments
Tags: I will code your EAs and Indicators for no charge
Cancel

I will code your EAs and Indicators for no charge

  • Last Post
  •  
  • 1 20092010Page 201120122013 2921
  • 1 Page 2011 2921
  •  
  • Post #40,201
  • Quote
  • Oct 10, 2020 4:03pm Oct 10, 2020 4:03pm
  •  rpasupathy
  • Joined May 2008 | Status: Member | 319 Posts
Quoting redfan
Disliked
{quote} As you can see the US is the weakest currency it is completely red the Australian currency is the strongest followed by the New Zealand currency then the British pound and lastly the Canadian currency, The Japanese is the second weakest currency followed by the EU. AUDUSD strong buy AUDJPY strong buy NZDUSD strong buy NZDJPY strong buy This is how I trade my currencies strongest vs weakest If you want this indicator you have to have a blank chart to put it on, you cannot put anything else on the chart. {image} {file}
Ignored

Very Nice ...

Thanks a lot ...

How do you make it to show all the things in the chart .... I am not able to see the ALERTS as it doesnt fit in the chart ...
The One Who Makes The Thunder Roar Also Hears A Butterfly Sigh - Ruzbeh
 
 
  • Post #40,202
  • Quote
  • Oct 10, 2020 4:19pm Oct 10, 2020 4:19pm
  •  Hutch
  • Joined Apr 2010 | Status: Lazy trader on D1 charts | 5,906 Posts
Quoting pressium
Disliked
{quote} Hello Hutch, if you don't mind, will you please share this indicator? Thanks {image}
Ignored
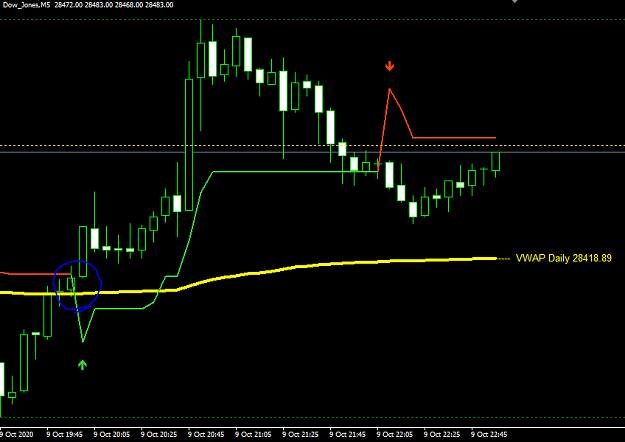
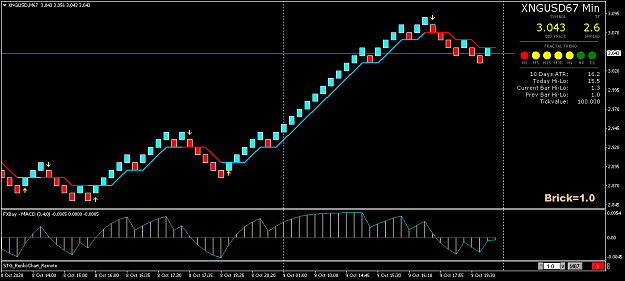
In case someone asks here is the full strategy. The Renko generator is the STG Renko Chart indicator and is to be placed on the M1 chart. Please note that the STG Renko Chart indicator was designed to trade currency pairs not CFDs. As a result to produce a 20 bricks Renko Chart similar to the DJ30 chart that I posted you need to put 200 as the Renko brick size on the M1 chart. Actually for all CFDs you have to indicate 10 times the brick size you want on the M1 chart. On the other hand you will get the correct brick size indicated on the STG Renko Chart Remote on the Renko chart that was produced by the STG Renko Chart indicator. Please note that you have to refresh the M1 chart by putting the Renko brick size (200 for Renko 20 bricks for the DJ30) every time you first use it for the day. To avoid this you might want to choose another Renko chart builder EA/Indicator. Below is my Natural Gas Renko chart. On the M1 chart I put the Renko brick size as 10 to get a Renko brick size of 1 on the Renko chart.
Attached Image (click to enlarge)
Click to Enlarge

Name: XNGUSDM67.png
Size: 32 KB
Attached File(s)
File Type: ex4 STG_RenkoChart.ex4   143 KB | 343 downloads
File Type: ex4 STG_RenkoChart_Remote.ex4   117 KB | 342 downloads
File Type: ex4 HalfTrend TT [x5v4].ex4   27 KB | 361 downloads
File Type: ex4 Infoboard.ex4   63 KB | 332 downloads
File Type: ex4 Renko_Brick_Size.ex4   12 KB | 371 downloads
File Type: ex4 FXBay_-_MACD.ex4   10 KB | 355 downloads
File Type: tpl US30.tpl   104 KB | 317 downloads
 
8
  • Post #40,203
  • Quote
  • Oct 10, 2020 5:23pm Oct 10, 2020 5:23pm
  •  vinscal
  • | Joined Sep 2020 | Status: Member | 11 Posts
Hi Bluerain

Can you please help me in adding an feature of supertrend (atrperiod and multiplier changeable ) crossover in this attached vwap indicator with a big arrow &crossoverlabel with alert.

supertrend crosses vwapdaily
Attached Image (click to enlarge)
Click to Enlarge

Name: Screenshot2.png
Size: 30 KB


Thanks
Attached File(s)
File Type: mq4 VWAP_DayWeekMonth_wLabel_wMAcross_wAlert.mq4   18 KB | 228 downloads
File Type: mq4 xSuperTrend & alerts nmc (2.01).mq4   9 KB | 221 downloads
 
 
  • Post #40,204
  • Quote
  • Oct 11, 2020 1:29am Oct 11, 2020 1:29am
  •  LearnALot
  • | Joined May 2020 | Status: Member | 23 Posts
Hi all,
First a huge thanks to all the coders and contributors who put in their time and skills to help folks like us

I have this indicator, which is a bollinger band indicator with touch alert, and I was wondering if a small horizontal ray, maybe 3-4 candles wide, could be placed at the exact point when price touches one of the bands. The ray should not move once created. I'm trying to gather statistics on price behavior when price touches the bands but the strategy tester makes it very difficult on my eyes.

I know it sounds like a very silly request, but I think useful info could be gathered from this function!
Attached File(s)
File Type: mq4 bollitoucher_alerts+mtf nmc.mq4   8 KB | 151 downloads
 
 
  • Post #40,205
  • Quote
  • Oct 11, 2020 1:39am Oct 11, 2020 1:39am
  •  jacem
  • Joined Jan 2014 | Status: Member | 58 Posts
Quoting Samalin
Disliked
{quote} Please how do you use this? how did this past data now become useful in the present?
Ignored
The idea is the same as what redfan described.
It shows the strength of different currencies. The difference is that here you can see not only the momentary strength, but the process in retrospect. And it is advisable to trade on pairs of opposite strengths. For example, on the M5 time plane, the indicator shows the opposite of two pairs, in which case it is worth looking for an entry in the correct direction on the M1 chart. (anno 919gilead invented it this way in my interpretation).

(Sorry for the quality of my writing, I don't know English, I wrote this description with a translator.)
 
2
  • Post #40,206
  • Quote
  • Oct 11, 2020 3:21am Oct 11, 2020 3:21am
  •  sevenrows
  • | Joined Oct 2020 | Status: Junior Member | 1 Post
Quoting jeanlouie
Disliked
{quote} MAs_MTF_toggle_v1.4 - shift input added pic has 1 of the 10sma's with a 5shift {image} {file}
Ignored
Can the cross period moving average be smoothed?
 
 
  • Post #40,207
  • Quote
  • Oct 11, 2020 4:29am Oct 11, 2020 4:29am
  •  genuine007
  • | Joined Sep 2020 | Status: Member | 112 Posts
Quoting BlueRain
Disliked
{quote} I added extra space so it should display correct now. Regarding 0,10,100 what does it mean? can you explain a bit more? {file}
Ignored
everything is good in this version, but the total column.. it ALWAYS show in "green" color
whereas the green color is for positive pips and red color for negative pips
for TOTAL any other color would be a great option like White, Aqua, Pink or whatever as per the user taste..
please try to include this feature also in your next version..
INPUTS, TOTAL COLOR = White etc
 
 
  • Post #40,208
  • Quote
  • Oct 11, 2020 6:53am Oct 11, 2020 6:53am
  •  Motiram
  • | Joined Nov 2014 | Status: Member | 567 Posts
Quoting jeanlouie
Disliked
{quote} MAs_MTF_toggle_v1.4 - shift input added pic has 1 of the 10sma's with a 5shift {image} {file}
Ignored
Quoting Motiram
Disliked
Hello to all I need an indicator, which can "Plot High & Low Horizontal Lines on Any selected number of BackBar" and extend lines till current candle +1. And it must have the following options if possible... 1-indicator can be loaded multiple time. 2-indicator have option to plot lines on the any selected back bar. 3-can be changed the line colour, style, thickness etc. 4-show the number of the bar it is used. 5-refresh when new candle opens. 6-it could be MTF Please see the image attached for detailed. Regards Moti {image}
Ignored
Hello jeanlouie,

Please can you make the breakout indicator "Plot High & Low Horizontal Lines on Any selected number of BackBar" for me I did request in the link above when you can?

Kind Regards
Moti
 
 
  • Post #40,209
  • Quote
  • Oct 11, 2020 6:57am Oct 11, 2020 6:57am
  •  T4Trade
  • Joined Sep 2017 | Status: Trend Following,Price Action,Grid | 2,090 Posts
please can someone add arrow when 3-4 tf is same color thanks
Attached File(s)
File Type: mq4 4 time frame MACD nmc.mq4   9 KB | 164 downloads
 
 
  • Post #40,210
  • Quote
  • Oct 11, 2020 7:39am Oct 11, 2020 7:39am
  •  lucky1359
  • Joined Nov 2018 | Status: Member | 1,051 Posts
Quoting BlueRain
Disliked
{quote} I added extra space so it should display correct now. Regarding 0,10,100 what does it mean? can you explain a bit more? {file}
Ignored
Thank you very much Bluerain. With extra space added the results look so neat.

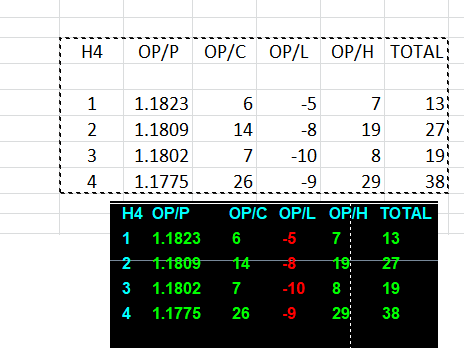
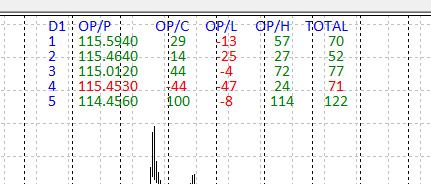
regarding 0,10,100 i am attaching a picture

Attached Image

the excel image shows the right way, the results should be seen on screen
see the difference between both the images, how the numbers are plotted and u will understand.

Everything is Good now but If you can do a favour
the last total column
if a particular time frame closes to a higher price then the open - the answer in total column color should be green
and if closes lower then the open price color should be red

Hope you understand my point.
Everything is perfect in the indicator till now

Thanks in Advance

Thanks & Regards
 
1
  • Post #40,211
  • Quote
  • Oct 11, 2020 8:14am Oct 11, 2020 8:14am
  •  classy
  • Joined Jun 2012 | Status: Trader , Analyst and Mentor | 4,580 Posts
Quoting classy
Disliked
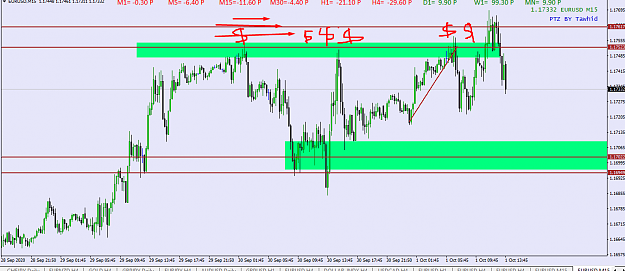
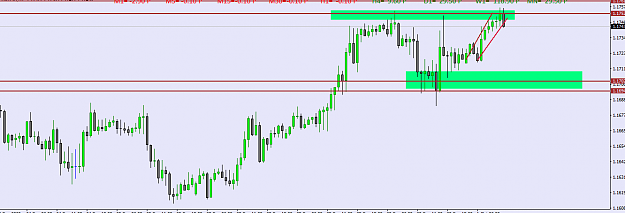
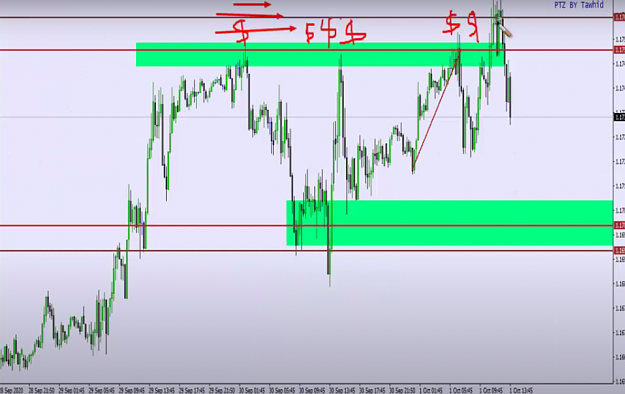
My Humble request to all master coders please create one indicator or script which show equal high=low horizontal line (consider close price or candle body only)different color for different color horizontal line will be great.i searched a lot on net but no luck........thanks in advance ONE IMAGE CAN express more clearly than 100 words {image}
Ignored
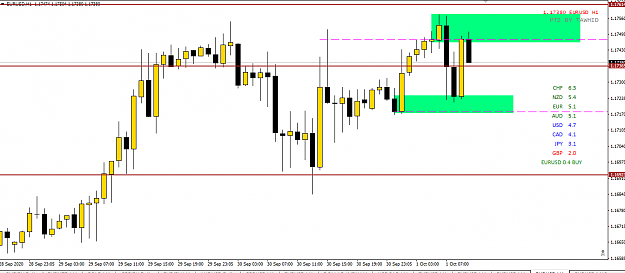
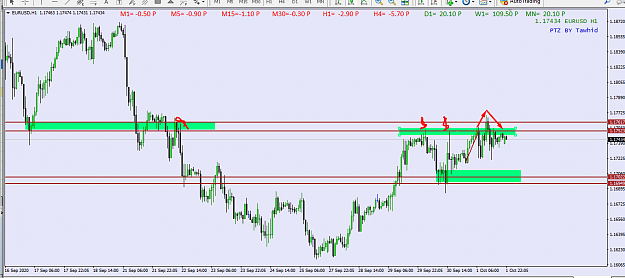
I am STILL LOKING FOR equal high-low break(immediate break and fall stop-hunt) .that equal high low created by smart money for trap retail traders like us , to deceive us , to grab our stop-loss and pending buy-sell stop . smart money create this equal high-low in all time frame again and again. i bracketed 100/1000 times manually or with my eyes. i think one indicator with push notification or dashboard will be great loos/roadmap for any traders. Some more real recent example
Attached Image(s) (click to enlarge)
Click to Enlarge

Name: eur usd 15 min qml 1H  ptz.png
Size: 36 KB
Click to Enlarge

Name: eur usd 15 min qml ptz.png
Size: 38 KB
Click to Enlarge

Name: EUR USD NY SESSION PTZ 1 2octber.png
Size: 48 KB
Click to Enlarge

Name: EUR USD NY SESSION PTZ 1.png
Size: 47 KB
Click to Enlarge

Name: EUSD REAP ZONE PTZ trapped.png
Size: 38 KB
Click to Enlarge

Name: EUSD REAP ZONE PTZ.png
Size: 25 KB
Click to Enlarge

Name: gold traped 2.png
Size: 316 KB
Say something meaningful or Silence!!
 
1
  • Post #40,212
  • Quote
  • Oct 11, 2020 8:33am Oct 11, 2020 8:33am
  •  stesy
  • | Joined Nov 2016 | Status: Member | 87 Posts
Quoting jeanlouie
Disliked
{quote} MAs_MTF_toggle_v1.4 - shift input added pic has 1 of the 10sma's with a 5shift {image} {file}
Ignored
jeanlouie I was about to ask for the 1.3 but I guess this is the latest and updated version , every time I switch TMF it show on , can you please set off by default so there no need to switch off every time timeframe is changed

Thank you
 
 
  • Post #40,213
  • Quote
  • Oct 11, 2020 11:31am Oct 11, 2020 11:31am
  •  pressium
  • | Joined Oct 2020 | Status: Member | 9 Posts
Quoting Hutch
Disliked
{quote} In case someone asks here is the full strategy. The Renko generator is the STG Renko Chart indicator and is to be placed on the M1 chart. Please note that the STG Renko Chart indicator was designed to trade currency pairs not CFDs. As a result to produce a 20 bricks Renko Chart similar to the DJ30 chart that I posted you need to put 200 as the Renko brick size on the M1 chart. Actually for all CFDs you have to indicate 10 times the brick size you want on the M1 chart. On the other hand you will get the correct brick size indicated on the...
Ignored

Thank you very much, Hutch!!! Really appreciate it
 
 
  • Post #40,214
  • Quote
  • Oct 11, 2020 11:37am Oct 11, 2020 11:37am
  •  tbardos
  • | Joined Oct 2020 | Status: Junior Member | 1 Post
Quoting BigBlueWhale
Disliked
Hey all! I'm Jason, first post here on FF, but longtime lurker. I'm starting to more and more interested in automated EA's, but not in the common sense of their usage. I'm mainly looking to use them to develop and improve my trading system Big Blue Whale. I'm currently using an automated timed stop loss for each of my trades via an EA i found on the forums, but I was hoping to find someone who may be able to help me modify this EA or create another EA to automatically close a position if a certain amount of time has passed since it reached within...
Ignored
Jason,
Would you care to share the BigBlueWhale with me? I have a similar idear of trading (WTI) and would rather rely on a working program than creating a new one.
Regards,
Tamas
 
 
  • Post #40,215
  • Quote
  • Oct 11, 2020 11:40am Oct 11, 2020 11:40am
  •  pressium
  • | Joined Oct 2020 | Status: Member | 9 Posts
Quoting Hutch
Disliked
{quote} In case someone asks here is the full strategy. The Renko generator is the STG Renko Chart indicator and is to be placed on the M1 chart. Please note that the STG Renko Chart indicator was designed to trade currency pairs not CFDs. As a result to produce a 20 bricks Renko Chart similar to the DJ30 chart that I posted you need to put 200 as the Renko brick size on the M1 chart. Actually for all CFDs you have to indicate 10 times the brick size you want on the M1 chart. On the other hand you will get the correct brick size indicated on the...
Ignored

Hello Hutch, would like to know more about your system. How do you use these 2 indicator (halftrend & macd) in order to place buy & sell order? I mean ideal buy & sell conditions that you're looking for when placing orders.
 
 
  • Post #40,216
  • Quote
  • Oct 11, 2020 12:36pm Oct 11, 2020 12:36pm
  •  redfan
  • Joined Sep 2011 | Status: Member | 1,079 Posts
Quoting rpasupathy
Disliked
{quote} Very Nice ... Thanks a lot ... How do you make it to show all the things in the chart .... I am not able to see the ALERTS as it doesnt fit in the chart ...
Ignored
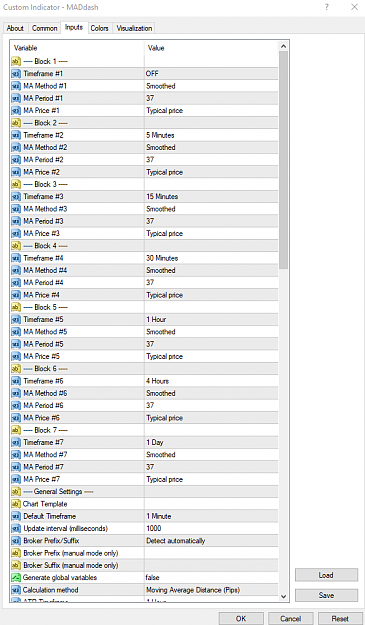
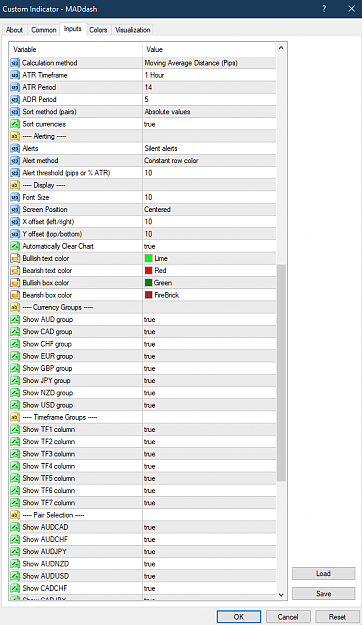
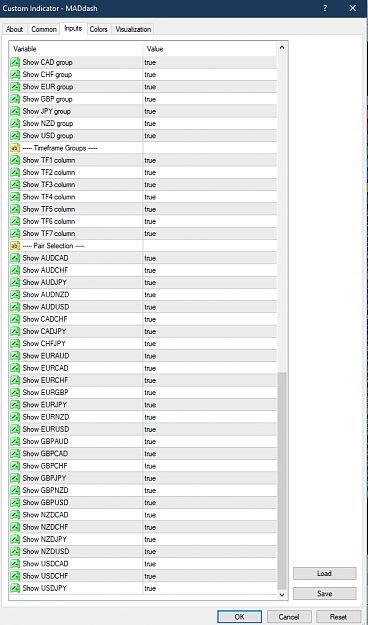
These are my settings for anyone who has downloaded the indicator,
Good luck and stay safe.
Attached Image (click to enlarge)
Click to Enlarge

Name: part1.png
Size: 73 KB
Attached Image (click to enlarge)
Click to Enlarge

Name: part2.png
Size: 71 KB
Attached Image (click to enlarge)
Click to Enlarge

Name: part3.png
Size: 74 KB
 
2
  • Post #40,217
  • Quote
  • Oct 11, 2020 12:42pm Oct 11, 2020 12:42pm
  •  redfan
  • Joined Sep 2011 | Status: Member | 1,079 Posts
Quoting lucky1359
Disliked
{quote} Thank you very much Bluerain. With extra space added the results look so neat. regarding 0,10,100 i am attaching a picture {image} the excel image shows the right way, the results should be seen on screen see the difference between both the images, how the numbers are plotted and u will understand. Everything is Good now but If you can do a favour the last total column if a particular time frame closes to a higher price then the open - the answer in total column color should be green and if closes lower then the open price color should be...
Ignored
Yes that's great lucky1359 , I was thinking something like that should happen.
You and BlueRain I've really done a good job on this.
thank you to you both
be lucky stay safe.
 
1
  • Post #40,218
  • Quote
  • Oct 11, 2020 12:55pm Oct 11, 2020 12:55pm
  •  MyProfit
  • | Joined Jan 2018 | Status: Member | 237 Posts
Hi Fellow Coders....
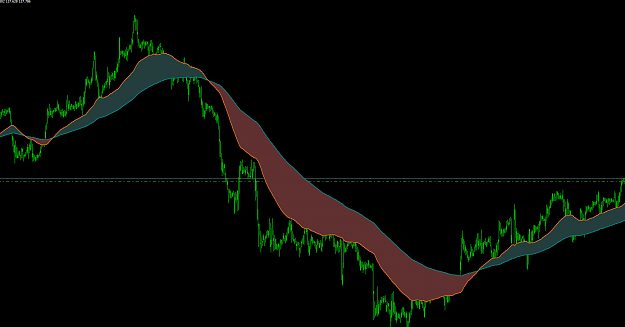
Wondering if you could code an on-off button of the Ma Ribbon filled indicator..

Thanks
Attached Image (click to enlarge)
Click to Enlarge

Name: Ribbon Filled.png
Size: 44 KB
Attached File(s)
File Type: mq4 MA ribbon filled + shift 1.03 mtf nmc.mq4   7 KB | 232 downloads
"Great Men are not born great, They Grow Great."
 
1
  • Post #40,219
  • Quote
  • Oct 11, 2020 1:23pm Oct 11, 2020 1:23pm
  •  Bankpips
  • | Joined Mar 2012 | Status: Member | 83 Posts
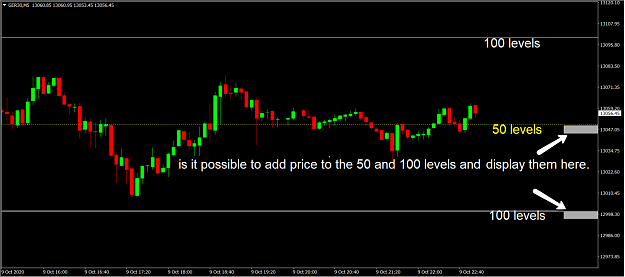
Can you add prices to the Sweetspots levels
Attached Image (click to enlarge)
Click to Enlarge

Name: Sweetspot prices.png
Size: 142 KB
Attached File(s)
File Type: mq4 SweetSpots.mq4   4 KB | 140 downloads
 
 
  • Post #40,220
  • Quote
  • Oct 11, 2020 4:49pm Oct 11, 2020 4:49pm
  •  BlueRain
  • Joined Sep 2019 | Status: Member | 1,053 Posts
Quoting lucky1359
Disliked
{quote} Thank you very much Bluerain. With extra space added the results look so neat. regarding 0,10,100 i am attaching a picture {image} the excel image shows the right way, the results should be seen on screen see the difference between both the images, how the numbers are plotted and u will understand. Everything is Good now but If you can do a favour the last total column if a particular time frame closes to a higher price then the open - the answer in total column color should be green and if closes lower then the open price color should be...
Ignored
Got it. I changed color and numbers will be right justified.
MT4 doesn't have any good way of right justification .. so it would be blank filled in front to looks like justified.
Attached Image
Attached File(s)
File Type: mq4 PipMoved HLOC mtf.mq4   31 KB | 166 downloads
 
1
  • Platform Tech
  • /
  • I will code your EAs and Indicators for no charge
  • Reply to Thread
    • 1 20092010Page 201120122013 2921
    • 1 Page 2011 2921
15 traders viewing now, 3 are members:
Invisible
,
kodziro
,
osnatw
  • More
Top of Page
  • Facebook
  • Twitter
About FF
  • Mission
  • Products
  • User Guide
  • Media Kit
  • Blog
  • Contact
FF Products
  • Forums
  • Trades
  • Calendar
  • News
  • Market
  • Brokers
  • Trade Explorer
FF Website
  • Homepage
  • Search
  • Members
  • Report a Bug
Follow FF
  • Facebook
  • Twitter

FF Sister Sites:

  • Metals Mine
  • Energy EXCH
  • Crypto Craft

Forex Factory® is a brand of Fair Economy, Inc.

Terms of Service / ©2023