My Humble request to all master coders please create one indicator or script which show equal high=low horizontal line (consider close price or candle body only)different color for different color horizontal line will be great.i searched a lot on net but no luck........thanks in advance
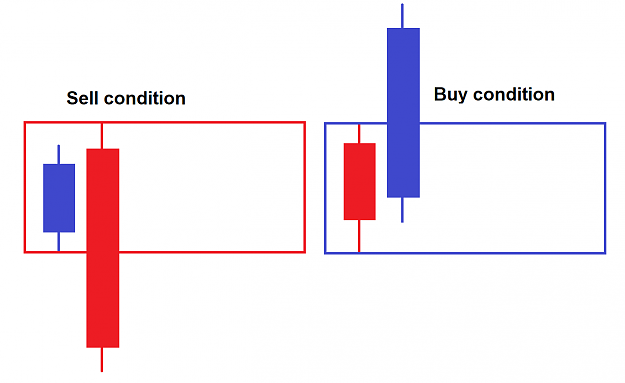
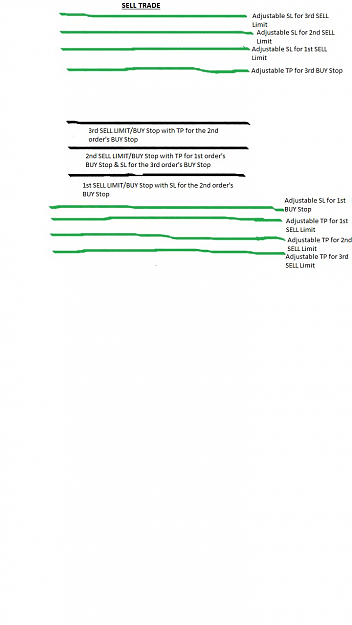
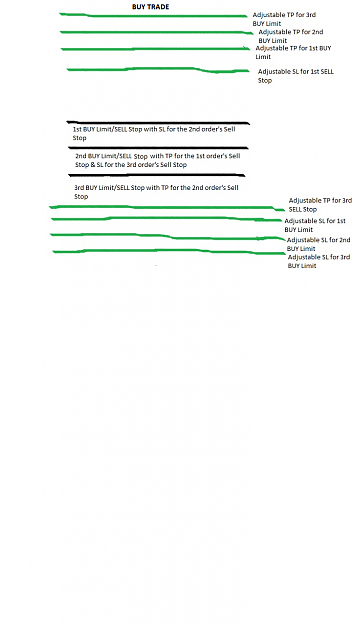
ONE IMAGE CAN express more clearly than 100 words
ONE IMAGE CAN express more clearly than 100 words
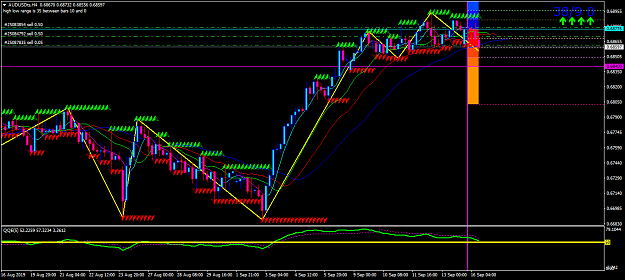
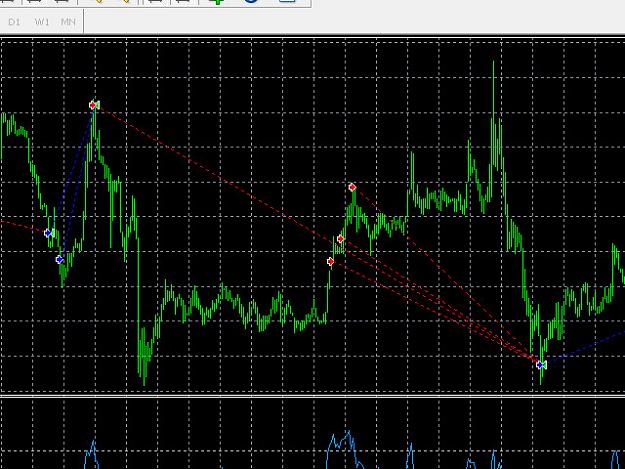
Attached Image (click to enlarge)
Say something meaningful or Silence!!