{quote} Not sure if you can quote others yet, but if you could have, you should quote from the post, because I may not have seen this. Your English seems good. Email alerts added. {file}
Ignored
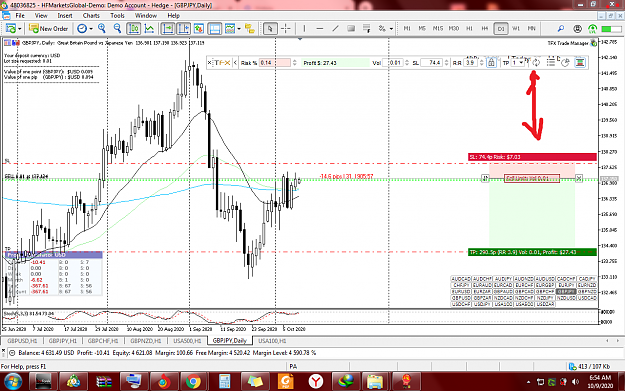
Sorry for the inconvenience, but I see that the indicator only has popup and push alerts, but does not have the option to send email alerts.
{quote} Chart High Number can be changed if you widen/narrow chart size. if you have your pair watch list smaller, it will be smaller window and smaller numbers. Those are not fixed. Only thing doesn't change is High/Low which you can get from your 1 min chart. There are few tools you can get those tick chart as indicator chart - try this first. - from one of FF. {file}
Ignored
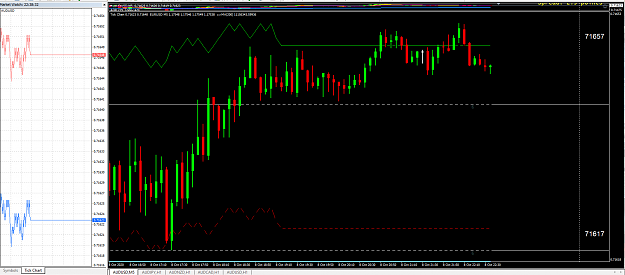
Thanks for the indicator, I've managed to put it on and add a chart on to it, I'm going to try and put the numbers on manually, and test it. The trouble is while you are messing about putting these numbers on it can move pretty fast when it expands and then contracts. There's a pictures so you can see where I'm up to thanks for all your time,
If you know anything about the way pips work in trading, please let me know , I've been studying this indicator for 2 days now, I will put a picture on, let me know if you can make sense of why the green candle the price has been took from the bottom and not the top,
I need an indicator, which can "Plot High & Low Horizontal Lines on Any selected number of BackBar" and extend lines till current candle +1.
And it must have the following options if possible...
1-indicator can be loaded multiple time.
2-indicator have option to plot lines on the any selected back bar.
3-can be changed the line colour, style, thickness etc.
4-show the number of the bar it is used.
5-refresh when new candle opens.
6-it could be MTF
{quote} I think it's this one I downloaded it the other day. {file} If you know anything about the way pips work in trading, please let me know , I've been studying this indicator for 2 days now, I will put a picture on, let me know if you can make sense of why the green candle the price has been took from the bottom and not the top, {image}
Ignored
Those are open price of bar.
that bar is up bar so, bottom is open bar.
{quote} I think it's this one I downloaded it the other day. {file} If you know anything about the way pips work in trading, please let me know , I've been studying this indicator for 2 days now, I will put a picture on, let me know if you can make sense of why the green candle the price has been took from the bottom and not the top, {image}
Ignored
Hello Redfan,
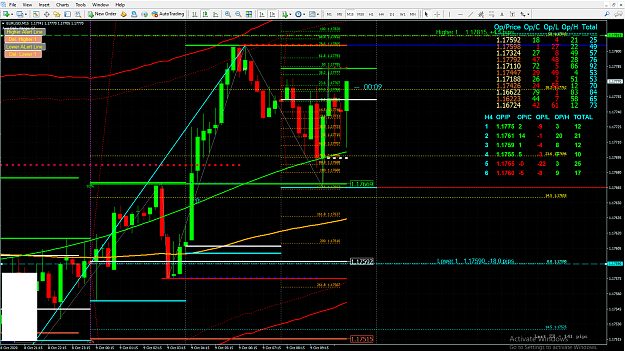
The 1st column in our indicator is is H4 Timeframe.
It reflects the Open price of that H4 Time Frame.
So the Green candle took the Opening price which is 124.613
Second column reflects open to close. - how many pips were gained in that time frame here it is 4 hour - so it reflects it gained 13 pips in that timeframe
Third Open to Low - how much low it went - it went 3 pips low only
4th open to high - how much high it went - it went 21 pips high
5th total - how much low to high or high to low was the range for that timeframe - it is 24 pips
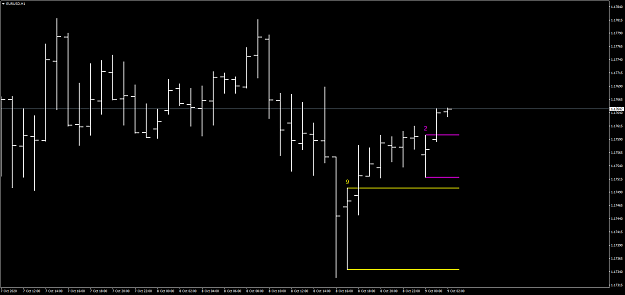
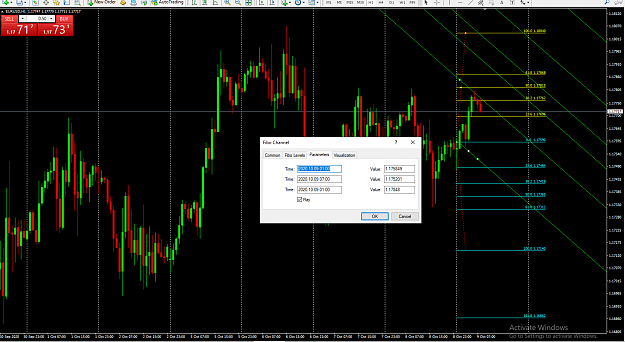
{quote} Thank you Very much mntiwana I have seen you posting many indicators of Mladen and guiding the community the right use of it. Thank you once again. This is the perfect indicator i was looking for. I have a query mntiwana and feel that you can solve it. The query is I want to draw a FIBONACCI CHANNEL with defined prices as we plot a normal Manual Fibo. How can i draw a channel with start price of the day Herewith i am attaching a Fibo chart with prices can u please help me to attach a Fibonacci Channel to match with the prices...
Ignored
I doubts,not able to pick your point or out of my range/capacity
{quote} I doubts,not able to pick your point or out of my range/capacity
Ignored
Thank you mntiwana,
I also had tried many times and could not come out with a conclusion so i asked you.
There would be a method of drawing a Fibo Channel manually starting from the price day start
to the other fibo levels.
An nothing is out of range dear . Then also if you come up with some conclusion please also let me know.
{quote} Thank you mntiwana, I also had tried many times and could not come out with a conclusion so i asked you. There would be a method of drawing a Fibo Channel manually starting from the price day start to the other fibo levels. An nothing is out of range dear . Then also if you come up with some conclusion please also let me know. Have a nice day. Thanks & regards
Ignored
Yet unable to understand what you trying to say/ask
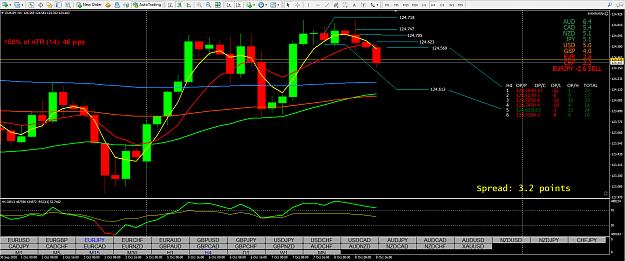
Currency Strength helps a lot to determine a trade. Of all currency meter Forex Profit Supreme is a nice one
but this indicator does not have the option of X Position - Y Position to move it on the chart.
Can you please add the X Position - Y Position so it can be moved on chart
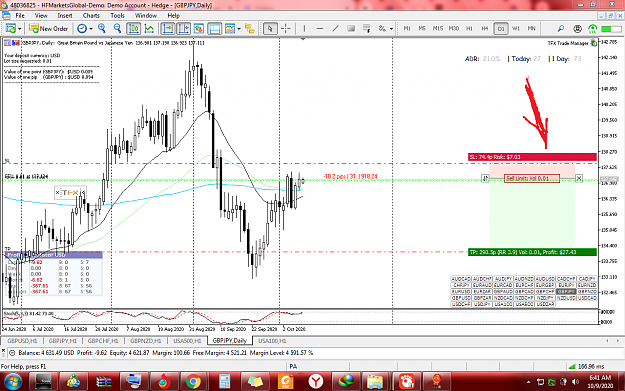
Good day, please I would like someone to code this risk/ reward expert/ indicator to work for both Mt4 and Mt5 so it can be used for all pairs. This is a wonderful tool to have. its a very useful indicator on TradingView but cant be found on Metatrader. Thanks
Good Morning Dear Coders, Currency Strength helps a lot to determine a trade. Of all currency meter Forex Profit Supreme is a nice one but this indicator does not have the option of X Position - Y Position to move it on the chart. Can you please add the X Position - Y Position so it can be moved on chart Have a Good Day. Thanks in Advance. Thanks & Regards. {file}
Ignored
Decompiled (theft/stolen) code,lurking around since long with different names
How are you ? Hope you are fine and in high spirits.
The Masterpiece Indicator you have created is working perfectly
and giving the Best of the Best Results. I want to Thank you from the
Bottom of my Heart for that.
There is a little bit Beautification of the Indicator.
1. the 2nd column OP/P is very close to the 3rd column OP/C so sometimes there is a problem reading it
specially when the currency is in 6 digits. We cannot give more space in the option provided by you because
that consumes more place on the chart.
2. the result in all the columns should start like 0, 10, 100 from extreme right something like these
0 10 100
i have attached an image above our H4 indi which reflects Day 1 data as per my above explanation