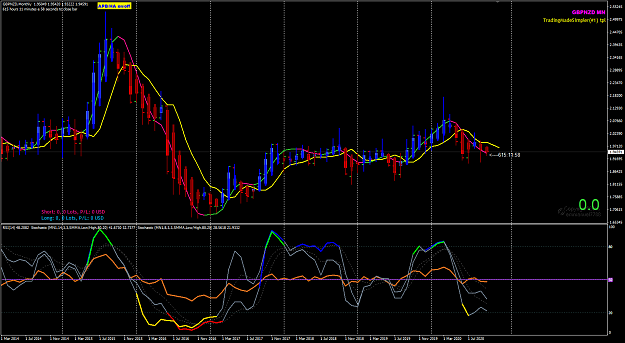
{quote} Hi Frank My GBPUSD Week 39 Sep 21 to 25 were D1 trades and I based on the Weekly market condition. Note when Friday Sep 18 closed, I see a sideways market type conditions and D1 was more bearish when I decided to sell. The Weekly sideways range was about 500 pips. Selling on Sep 21 would mean the worst case SL would be above 1.3264 i.e. above the high of that big Weekly candle of week 37. This is why my trade position size were very small and to allow me to scale-in and scale-out with several baskets of trades. {image} However, if you use...
Ignored
Thanks for your explanation. 2 more tiny questions as follows,
Regarding ur ATR based SL, what is the setting you recommend?
what does the pool of 3 to 5 pairs you mentioned look like? Do you mean, for instance, you would trade a bunch of GBP pairs at the same time? or u mean several pairs unrelated with each other? like AUDUSD, GBPJPY, EURNZD..
{quote} Thanks for your explanation. 2 more tiny questions as follows, Regarding ur ATR based SL, what is the setting you recommend? what does the pool of 3 to 5 pairs you mentioned look like? Do you mean, for instance, you would trade a bunch of GBP pairs at the same time? or u mean several pairs unrelated with each other? like AUDUSD, GBPJPY, EURNZD..
Ignored
1) Using market volatility ATR
- I look at the Weekly 52 weeks ATR and the Daily 100-days ATR when I plan my swing trades
- on my trading chart, for example on Daily I scan the ATR(10) for where the most recent "stop levels' are and compare that to the price action - the swings of the APB/HA candles and also the most recent big price bars/candles. Price tends to retirn to the big bars/candle and it is just a matter of how much time it takes...
2) I have 20 pairs (group #1 to #5) plus the BASKET pairs - EMBAsket, JPYBasket and USDollar. I also trade the SGD based pairs but on longer term positions to 'hedge' my postfolio.
- of the 20 pairs, these are group into 5 groups and I would avoid opening trades in 2 pairs or more paits in the same group, but when I do it would be that I divided my risk into smaller portions and trade much smaller lots sizes.
. Trading Currency Pairs – Six(6) Groups 2019
Group#1
AUDUSD
EURUSD
GBPUSD
USDCAD
NZDUSD
Group#2
EURAUD
EURNZD
EURCAD
EURGBP***
Group#3
GBPAUD
GBPNZD
GBPCAD
Group#4
USDJPY
AUDJPY
EURJPY
GBPJPY
SGDJPY
Group#5
AUDCAD
AUDNZD
NZDCAD
Group#6
AUDSGD
EURSGD
GBPSGD
USDSGD
NZDSGD
Honesty is a very expensive gift. You wont find it in cheap people.WBuffett
{quote} Hi Emm, Just looking at UC weekly close not being higher than the week before . Does this mean we can expect UC ranging for the following week and probably best to look elsewhere for a better trade? Maybe Covid trump is causing instability as well. It seems a lot of the pairs are in the same weekly position. Keep up with the very informative posts, I am just compiling a lot of them for future reference.
Ignored
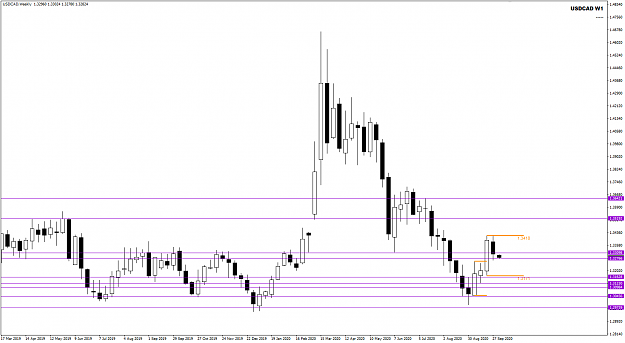
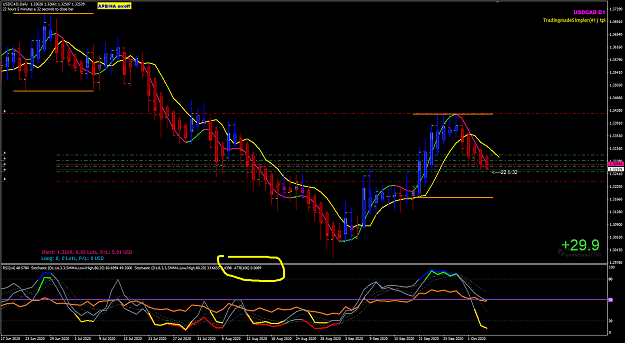
USDCAD Week 41 Oct 05 to 09
- on my Weekly, I see a big W1 with its high-low ( give that Weekly a proper name Weekly Control Candle WCC)
- that WCC high-low determines the range of the market I trade this week until there is a break of this range
- check that WCC high-low range and compare the Weekly ATR(52) weeks, is that narrow range or wide range?
Attached Image (click to enlarge)
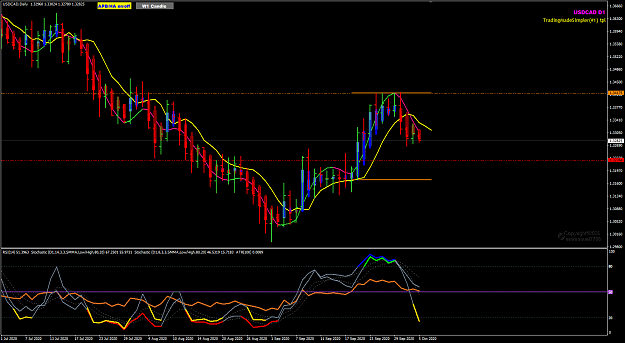
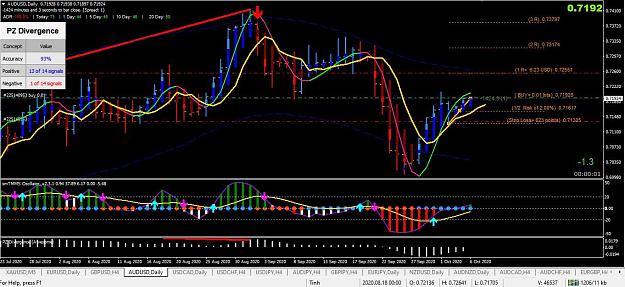
Daily trading chart (RH template #1)
- it easy decision to be selling, right?
- what if I follow the longer term buyers?
- caution this week's US FOMC and Canadian employment data!
- FOMC will play more on UJ than on UCad, but check Oil prices.
Attached Image (click to enlarge)
Honesty is a very expensive gift. You wont find it in cheap people.WBuffett
Hello emmanuel7788
Can you share your ATR Indicator for me? and how to use it to calculate SL.
Sorry my english is not good. I use Google translate.
Thank you
{quote} USDCAD Week 41 Oct 05 to 09 - on my Weekly, I see a big W1 with its high-low ( give that Weekly a proper name Weekly Control Candle WCC) - that WCC high-low determines the range of the market I trade this week until there is a break of this range - check that WCC high-low range and compare the Weekly ATR(52) weeks, is that narrow range or wide range? {image} Daily trading chart (RH template #1) - it easy decision to be selling, right? - what if I follow the longer term buyers? - caution this week's US FOMC and Canadian employment data! -...
Ignored
this is really great analyzing, thank you, emmanuel7788
a quick question:
if you put an order, saying buy limit, but the prices is up and you didn't get it , would you increase the price and chase it
or seek another chance
{quote} USDCAD Week 41 Oct 05 to 09 - on my Weekly, I see a big W1 with its high-low ( give that Weekly a proper name Weekly Control Candle WCC) - that WCC high-low determines the range of the market I trade this week until there is a break of this range - check that WCC high-low range and compare the Weekly ATR(52) weeks, is that narrow range or wide range? {image} Daily trading chart (RH template #1) - it easy decision to be selling, right? - what if I follow the longer term buyers? - caution this week's US FOMC and Canadian employment data! -...
Ignored
Hello emmanuel7788 there's another question, so you use 2ATR for stoplosss, and didn't use 2 back lower/higher bar from RB?
i think 2ATR usually means more risk, does this mean we need more reward for the risk?
thank you so much
{quote} Hello emmanuel7788 there's another question, so you use 2ATR for stoplosss, and didn't use 2 back lower/higher bar from RB? i think 2ATR usually means more risk, does this mean we need more reward for the risk? thank you so much
Ignored
Hello noke8868
using the 2xATR is to see where the volatility is and I would compare that with the price action.
using the 2 bars/candle look back is another way to see the price action , the previous 2 bars/candles low and high is good when you trade the CONTINUATION setups.
but I trade with multiple entries in one basket, therefore my initial stop loss can be much farther from the 2xATR.
using 2xATR for SL does not increase the risk of the trades because the positions size would be smaller when the SL is larger in pips but the money risk is the same for every basket.
I do not look at the R:R of individual trade or individual basket, but I look at the profit as Cash Flow and the R:R will work out after a long series of trade baskets.
Remember, the deposit in your broker trading account it to margin required to trade and this deposit is used to generate am amount of profit which is the cash flow you define for each of your own trading cycle. I use a 20-trading days cycle and with a money amount for my cut-loss in worst case scenario.
Honesty is a very expensive gift. You wont find it in cheap people.WBuffett
{quote} this is really great analyzing, thank you, emmanuel7788 a quick question: if you put an order, saying buy limit, but the prices is up and you didn't get it , would you increase the price and chase it or seek another chance
Ignored
just have a simple approach when you do your weekly top down analysis WTDA and stick to a consistent approach that work for you. With a consistent WTDA you form a big picture of the pair you want to trade and you have a better view of the market conditions, you will learn to trade the market conditions and follow the price with the indicators as your guide. Stick to one chart template like the template#1 in Post#1 and be DISCIPLINED.
Basic rule when trading the markets is "do not chase after the market " if the price had moved without you, simply let it go. You will learn why I trade the average entry price using multiple entries in one basket. I seldom miss an entry because my initial entry is always an market order with both limit and stop orders to fill-up a basket of trades. I don't need to be 'precise' with my initial order entry so long as the trade setup is there on my chart.
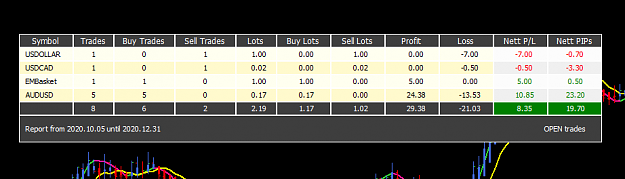
below is an example of my USDCAD trades open in progress now,
I have 2 open sell positions with average entry price of 1.3269, and limit & stop order above and below.
The stop order will be triggered as price move lower and the average entry price will move ... and I manage this new basket of trades. I can take profit anytime I want and I know the calendar events this week and will follow my trading tasks daily.
Attached Image (click to enlarge)
Honesty is a very expensive gift. You wont find it in cheap people.WBuffett
Hello emmanuel7788 Can you share your ATR Indicator for me? and how to use it to calculate SL. Sorry my english is not good. I use Google translate. Thank you
Ignored
Hello kecodon
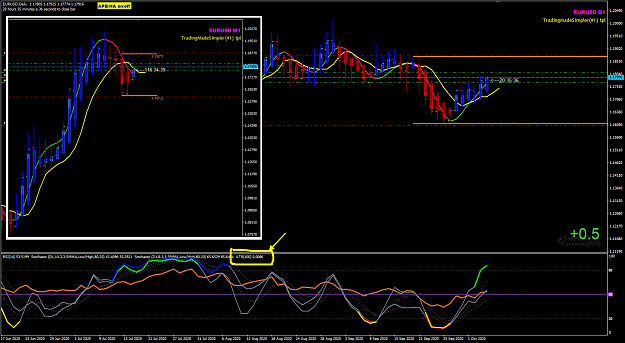
your trading platform has the ATR indicator, use that.
post a chart and I can explain how you can use the ATR when you do you trade planning.
For example, look at my USDCAD D1 chart above post. I have the ATR(100) on that Daily chart, that is the 100-days ATR ~ 89 pips.
Honesty is a very expensive gift. You wont find it in cheap people.WBuffett
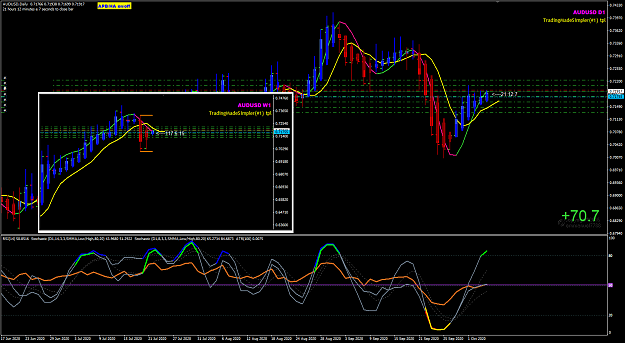
I have an open basket in profit now and there is RBA rate announcement in a few hours.
Whatever RBA does with the AUD rate, there is going to be volatility to fill orders but the weekly outlook will not change. AUDUSD is trading in sideways market type ... your WTDA will show a Weekly big bar/candle aka Weekly Control Candle WCC...its high-low range about 320 pips and I doubt today it can hit these high and low.
I follow my daily trading tasks, take the money before that hour and re-start a new basket.
Attached Image (click to enlarge)
Honesty is a very expensive gift. You wont find it in cheap people.WBuffett
Hello emmanuel7788 Can you share your ATR Indicator for me? and how to use it to calculate SL. Sorry my english is not good. I use Google translate. Thank you
Ignored
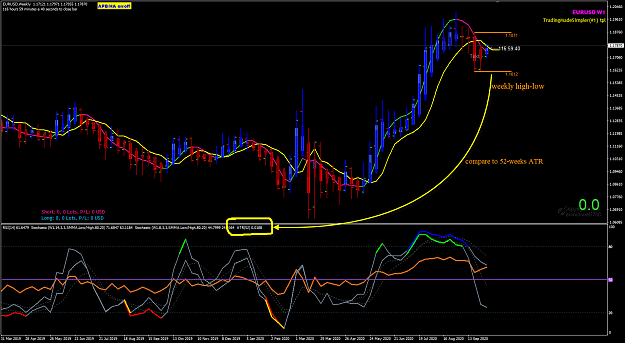
here is another example how to use the platform ATR
Weekly 52-weeks ATR on Weekly chart TF.
On my Weekly chart, I see a big bar/candle W1 High Low. What is that high-low range and compare that to the ATR(52) Weekly.
Next plan your trades with this information as one of your planning parameters.
Attached Image (click to enlarge)
Honesty is a very expensive gift. You wont find it in cheap people.WBuffett
- Weeklt Top Down Analysis WTDA show a WCC high Low and that is the market type condition now after the last bull rally.
- just open my first trade in a buy basket @Tokyo Open
- use the ATR(100) days information for average price entries, 5 trades in one basket with proper pips distance between each entry.
- build up positions in the market using baskets of trades.
Attached Image (click to enlarge)
Honesty is a very expensive gift. You wont find it in cheap people.WBuffett
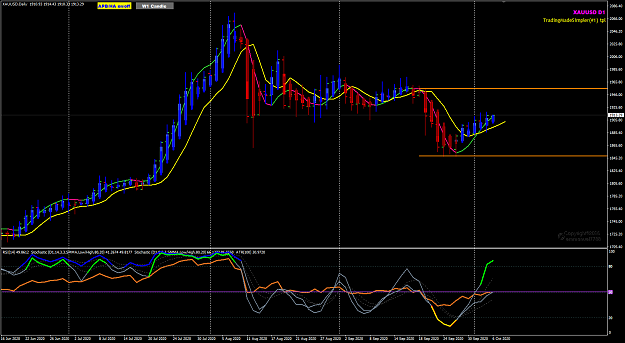
Anyone trading XAUUSD? Oct 06 Tokyo open Looks promising to make some money. {image}
Ignored
I keep my eyes on the XAU / USD but it looks like the price is testing the 1920 resistance. My expectation on the pair will be bearish. I've always followed the TMS (r) rules associated with higher timeframe consensus so probably less transactions. Last week I did not open a trade because it is against my trading plan. With the EU and AU pairs they seemed to be facing resistance on the daily timeframe so I stayed out waiting. I learned from you so much Emmanuel! Thank you so much!
{quote} I keep my eyes on the XAU / USD but it looks like the price is testing the 1920 resistance. My expectation on the pair will be bearish. I've always followed the TMS (r) rules associated with higher timeframe consensus so probably less transactions. Last week I did not open a trade because it is against my trading plan. With the EU and AU pairs they seemed to be facing support on the daily timeframe so I stayed out waiting. I learned from you so much Emmanuel! Thank you so much!
Ignored
simply watch the metal market prices from now till Nov 3.
its either you make money 2Rs...3Rs... 5Rs and have a good early year-end bonus or you lose just 1xR...
you balance -1R within your pool of trades.
when you lose (2 x -1R) and make (3 x 2Rs), you'll have your bonus by Nov 3.
work at it! work harder at it! I did for 20 years and still working hard every day.
Honesty is a very expensive gift. You wont find it in cheap people.WBuffett
{quote} simply watch the metal market prices from now till Nov 3. its either you make money 2Rs...3Rs... 5Rs and have a good early year-end bonus or you lose just 1xR... you balance -1R within your pool of trades. when you lose (2 x -1R) and make (3 x 2Rs), you'll have your bonus by Nov 3. work at it! work harder at it! I did for 20 years and still working hard every day.
Ignored
I will keep an eye on the metal market especially Gold. Although the price fluctuations of Gold are very annoying sometimes they go up or down suddenly. Sometimes they will go sideways for a long time and Gold seems to be influenced by the news a lot. Do you see that?
{quote} Hello kecodon your trading platform has the ATR indicator, use that. post a chart and I can explain how you can use the ATR when you do you trade planning. For example, look at my USDCAD D1 chart above post. I have the ATR(100) on that Daily chart, that is the 100-days ATR ~ 89 pips.
Ignored
Here is my chart but I can't find the ATR. Am I missing anything here?