{quote} no setup yet there mate.. or maybe already bull setup in play dowm there
Ignored
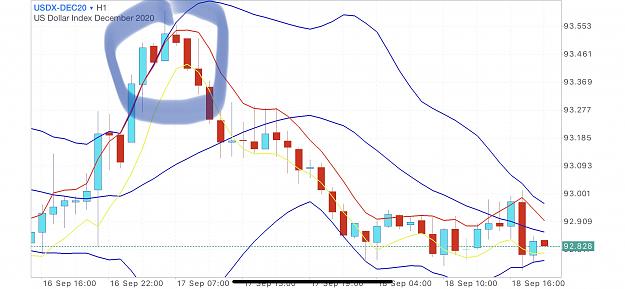
Looks like there was a closed candle outside outside the upper band then the red green red candles....Is it a failure because the Upper MA didnt go outside the BB?
EDIT: Looking for bull setup on GJ but also looking for the yen index to go down ...all yen pairs are trying to go up but blocked by resistance at weekly pivots....
{quote} Looks like there was a closed candle outside outside the upper band then the red green red candles....Is it a failure because the Upper MA didnt go outside the BB?
Ignored
nope mate..
wrong there..
wait i search some example
{quote} Looks like there was a closed candle outside outside the upper band then the red green red candles....Is it a failure because the Upper MA didnt go outside the BB? EDIT: Looking for bull setup on GJ but also looking for the yen index to go down ...all yen pairs are trying to go up but blocked by resistance at weekly pivots....
{quote} Looks like there was a closed candle outside outside the upper band then the red green red candles....Is it a failure because the Upper MA didnt go outside the BB? EDIT: Looking for bull setup on GJ but also looking for the yen index to go down ...all yen pairs are trying to go up but blocked by resistance at weekly pivots....
Ignored
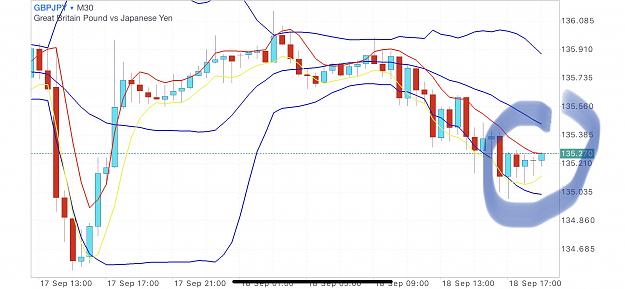
GJ..
here current bull setup..
also can look at monthly too
Appreciate the examples! I had reviewed most of the thread so thought I understood the setup....still not sure why the one on the yen index is invalid...Comparison below. Can anyone help clarify?
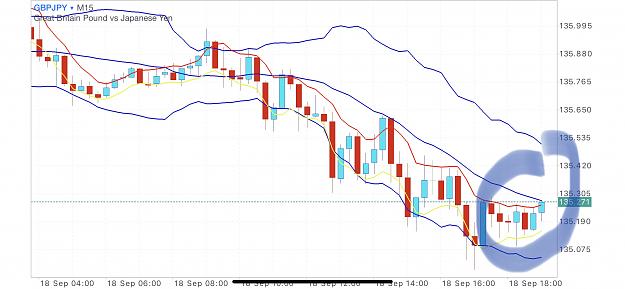
How come the chart for jap yen index so much breaks inbetween? puzzled..
Ignored
Yeah it's wierd - on trading view the JXY shows that gap at the start of each new day - Could be up or down....I dont have an explanation I just rolled with it.
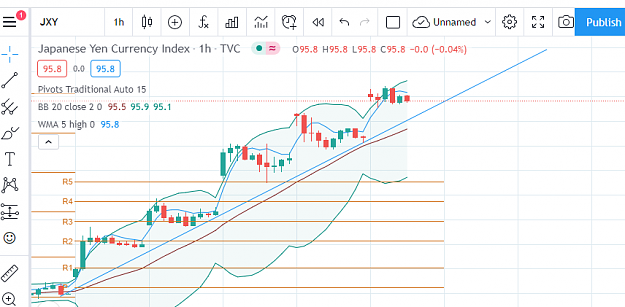
Appreciate the examples! I had reviewed most of the thread so thought I understood the setup....still not sure why the one on the yen index is invalid...Comparison below. Can anyone help clarify? {image}
Ignored
The sequence is usually bull bear bull then drop
Or bear bull bear then fly.
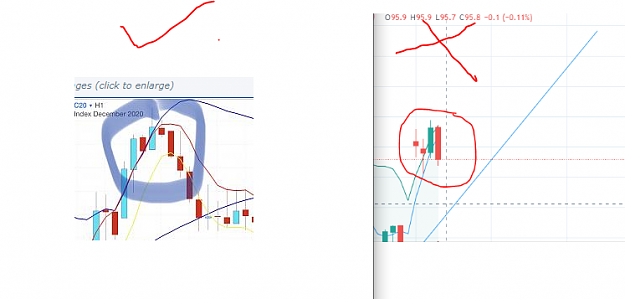
In the first picture there's the bull candle followed by a bear candle signalling the coming of bears, then another bull candle which is the retest and entry point to get the best prices.
For the second picture, I don't know if I'm seeing it correctly, but there's two bear candles then a bull candle followed by another bear candle in what looks like an uptrend, so it's not correct.
Akim, Comar, Longpuly and other traders here, DXY looks so helpless. I am seeing a pattern via H4 that can take dollar to 92.40 area and then 91.90 area. What are your views
Akim, Comar, Longpuly and other traders here, DXY looks so helpless. I am seeing a pattern that can take dollar to 92.40 area and then 91.90 area. What are your views
{quote} The sequence is usually bull bear bull then drop Or bear bull bear then fly. In the first picture there's the bull candle followed by a bear candle signalling the coming of bears, then another bull candle which is the retest and entry point to get the best prices. For the second picture, I don't know if I'm seeing it correctly, but there's two bear candles then a bull candle followed by another bear candle in what looks like an uptrend, so it's not correct. Boss Akim, I hope this is correct
Ignored
On the yen index in trading view it sometimes gaps up or down...not sure why. In the picture the "suspicious setup" was right after the gap up..the index gapped up then there is the doji that was entirely outside the bands ( i counted this first doji and the large gap as a bullish move since the gap was much larger than the doji) then another doji then the bull candle then the bear candle so I thought the conditions had been met. Probably best to ignore these possible setups when they aren't perfect but keeping and eye on the indices helps me with overall direction andIi thought this was a setup pointing the index down and therefore GJ, Ej Cj all might go up.
I attached a bigger snip of the yen index below for reference....
thx for the input guys...This may be helpful to others besides me