• Home
  • Forums
  • Trades
  • News
  • Calendar
  • Market
  • Brokers
  • Login
  • Join
  • User/Email: Password:
  • 3:56am
Menu
  • Forums
  • Trades
  • News
  • Calendar
  • Market
  • Brokers
  • Login
  • Join
  • 3:56am
Sister Sites
  • Metals Mine
  • Energy EXCH
  • Crypto Craft

Options

Bookmark Thread

First Page First Unread Last Page Last Post

Print Thread

Similar Threads

TOP 100 best things to-do in a Skype group: post ideas here 2 replies

5 EMA indicator on M15 chart and M5 chart 7 replies

Help with an indicator please - chart within chart 2 replies

I want to plot my custom indicator from a 5min chart onto a 1min chart 2 replies

Chart Setup Ideas (FX AccuCharts) 1 reply

  • Trading Systems
  • /
  • Reply to Thread
  • Subscribe
  • 1
Attachments: ideas on best indicator for daily chart
Exit Attachments
Tags: ideas on best indicator for daily chart
Cancel

ideas on best indicator for daily chart

  • Post #1
  • Quote
  • First Post: May 19, 2007 2:47pm May 19, 2007 2:47pm
  •  dragon77
  • | Joined Apr 2006 | Status: Member | 101 Posts
having spent years trying find the best chart to trade from I have finally decided on the daily. I would really like to consider opinions from similar traders esp which indicator is best,
My plan is set 1 trade per day at 0500 GMT on GBP/JPY so as to catch the close of biz in far east and open of London.

Which is the best indicator for the daily chart ?
  • Post #2
  • Quote
  • May 19, 2007 6:01pm May 19, 2007 6:01pm
  •  sergiu
  • | Joined May 2006 | Status: Least Qualified Poster | 444 Posts
Quoting dragon77
Disliked
having spent years trying find the best chart to trade from I have finally decided on the daily. I would really like to consider opinions from similar traders esp which indicator is best,
My plan is set 1 trade per day at 0500 GMT on GBP/JPY so as to catch the close of biz in far east and open of London.

Which is the best indicator for the daily chart ?
Ignored
As far as indicators go they are not tight to any time frame so i guess you should use whatever works for you. The only advice i can give you make sure you understand your indicators and how they are being calculated.
Good Luck!
Stubbornly persistent
 
 
  • Post #3
  • Quote
  • May 19, 2007 9:03pm May 19, 2007 9:03pm
  •  taxgeek
  • | Joined Jun 2006 | Status: Member | 144 Posts
None actually. Just trade the trend. If you just have to have some, find the moving average that most often acts as support for the pair when it's trending. Buy or sell on the pullbacks to the average (a la Cornflower). Then find the one that acts as second support. Same deal. Last but not least look for the one that when crossed signals at least a medium term trend change. Trade the cross of it on the first pullback to the first support average. The ones I use for EURUSD (varies from pair to pair) are 13 (first line of support),25 (the Vegas tunnel and @ one month average),50 (secondary trend support), and 100 (the long trend line). This way they are used as dynamic support. Combine that with static support, i.e. fibs, pivots, camarillas, trend lines, whatever trips your trigger, and you've got the only thing that really works on daily charts. If you want price to cross something, throw in a 50 period, 1 deviation Bollinger. That gives you momentum. Watch for the cross and a pullback to the 13 ema, which gives you trend and support. Price action, momentum, trend, and SR are what it's all about.
Indicator signals will usually get you in just at the right time to get killed especially on the daily. That's precisely what is wrong with most of the systems here. Indicators are used as trading signals rather than for determining trend and support. Once you know trend and support or resistance just trade the price action around those levels in the direction of the trend and add up the pips. This, of course, does not mean that any of this will necessarily work for you. Nor does it mean that it won't cost a lot of (hopefully demo) money to learn how it works. I suggest you take a look at Jacko's thread and the Cornflower thread (even though it's meant for one hour).
 
 
  • Post #4
  • Quote
  • May 19, 2007 9:49pm May 19, 2007 9:49pm
  •  CandlePower
  • | Joined Apr 2006 | Status: Member | 92 Posts
hi,

IMHO,

its depend on yur trading approach/type & yur understanding how the indicators react to the market. There are many types such like trend follower, range trader & breakout trader.

The approach is different & for sure the tools aslo different. What work for trend trader is not suitable for range trader. Simply like that.

Choose what suite yur taste & pay intention on yur money management.

regards,
cp6
 
 
  • Post #5
  • Quote
  • May 20, 2007 5:45am May 20, 2007 5:45am
  •  dragon77
  • | Joined Apr 2006 | Status: Member | 101 Posts
TAXGEEK

Many thanks for that, as you can probably guess i have not been able to find a suitable signal for the daily, the most success i have found so far is just to use the trend, ie last week or so and trade with it.

who invented the holy grail anyway ???
 
 
  • Post #6
  • Quote
  • Last Post: May 20, 2007 9:27pm May 20, 2007 9:27pm
  •  taxgeek
  • | Joined Jun 2006 | Status: Member | 144 Posts
Quoting dragon77
Disliked
TAXGEEK

Many thanks for that, as you can probably guess i have not been able to find a suitable signal for the daily, the most success i have found so far is just to use the trend, ie last week or so and trade with it.

who invented the holy grail anyway ???
Ignored
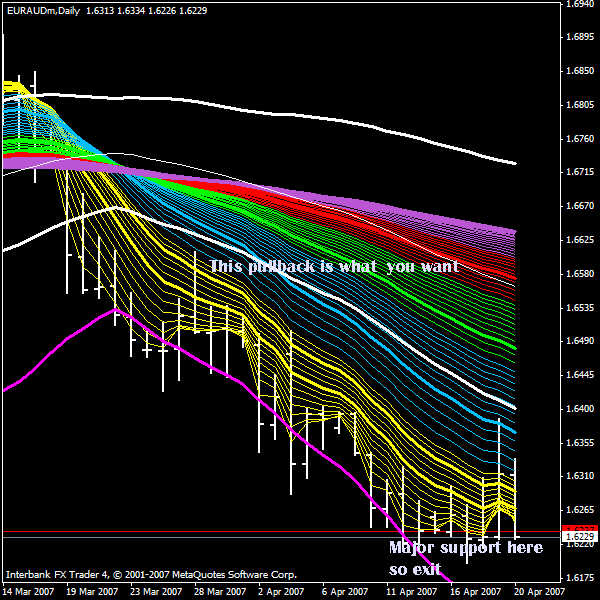
As Jacko says the way to find it is to look in the mirror. Trading is a matter of looking at the chart and internalizing it till it tells you its story, and then you trade with your gut. You really don't need a bunch of indicators for that, although they have their uses in showing divergence, trend and S/R. The emphasized lines in the rainbow are pretty much the ones I listed above. This is sort of based on Dave Landry's persistent pullbacks. You'll notice that it keeps pulling back toward the 13ema. That's not a time to exit but to add positions safely up to the first three pullbacks. Look to static and dynamic s/r for exits. If you don't get in on the first pullback, try it on the second or third. As long as you are trading with the trend, you should be able to get in. It's just a bit safer on the first.
Attached Image
 
 
  • Trading Systems
  • /
  • ideas on best indicator for daily chart
  • Reply to Thread
0 traders viewing now
Top of Page
  • Facebook
  • Twitter
About FF
  • Mission
  • Products
  • User Guide
  • Media Kit
  • Blog
  • Contact
FF Products
  • Forums
  • Trades
  • Calendar
  • News
  • Market
  • Brokers
  • Trade Explorer
FF Website
  • Homepage
  • Search
  • Members
  • Report a Bug
Follow FF
  • Facebook
  • Twitter

FF Sister Sites:

  • Metals Mine
  • Energy EXCH
  • Crypto Craft

Forex Factory® is a brand of Fair Economy, Inc.

Terms of Service / ©2023