{quote} yea, I realized I went short too soon after seeing the overlapping wave structure in the drop.
Ignored
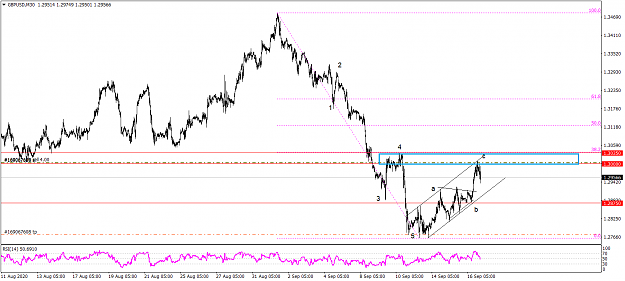
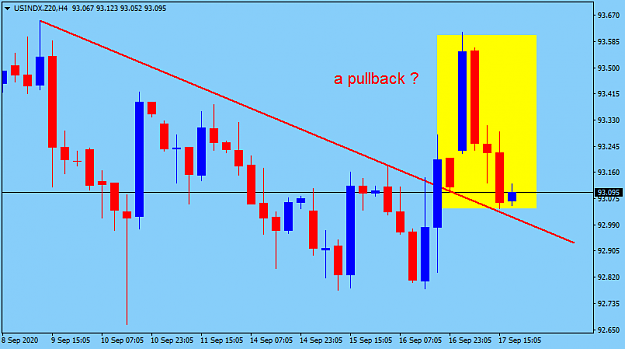
it was good intra-day trade (off of daily range ext.-yellow box and close to 100%dailyATR(14))... you got min time to the upside (3 days), now let's see if the retracement to the upside can be stretched to 5 days...did you have the feeling it doesn't want to go down?...
edit: I'm not saying it won't go lower...I just described my trade with my intra-day objective...
Always trade your own plan...I don't provide trading signals.
{quote} it was good intra-day trade (off of daily range ext.-yellow box and close to 100%dailyATR(14))... you got min time to the upside (3 days), now let's see if the retracement to the upside can be stretched to 5 days...did you have the feeling it doesn't want to go down?... edit: I'm not saying it won't go lower...I just described my trade with my intra-day objective...
Ignored
yea, it was good for 50-60 pips, more than enough as I went in with a 20 pips sl.
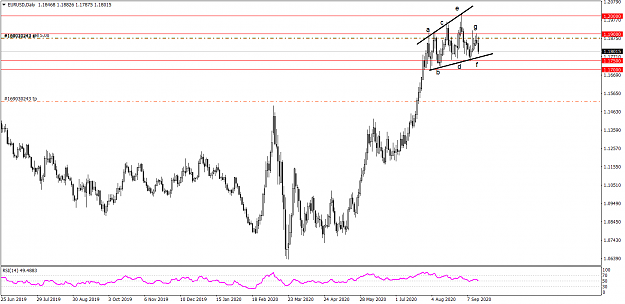
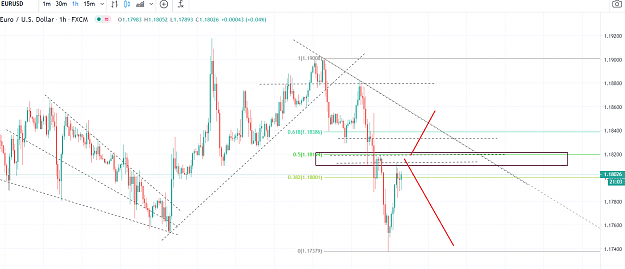
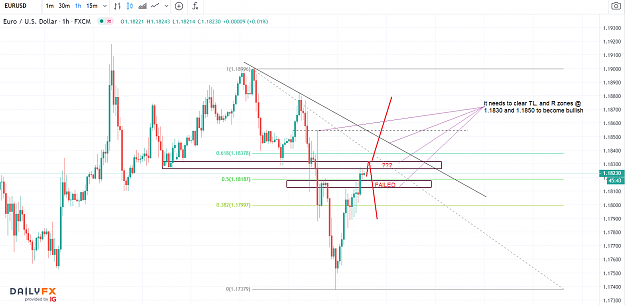
EURUSD, the rejection @ S zone 1.1750 was too strong to my liking. for now it's not very clear, can turn south from 1.18-1.1820 or break up again. {image}
Ignored
FX option expiries for Thursday September 17 at the 10am NY cut
EUR/USD
1.1700 501m euro
1.1775 530m
1.1800 943m 1.1850 1.2bn 1.1875 1.0bn
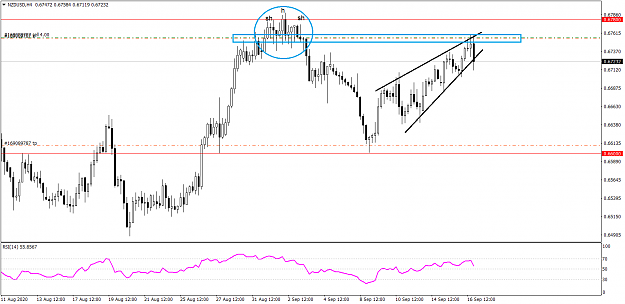
This might be the reason, they don't let this go down for now.
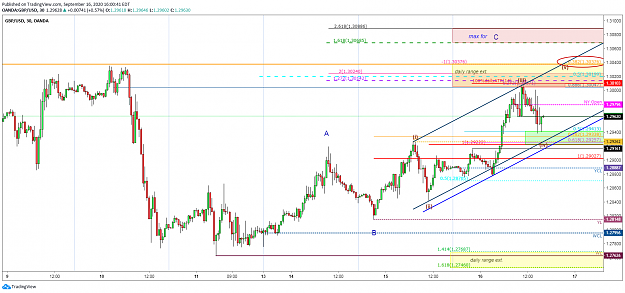
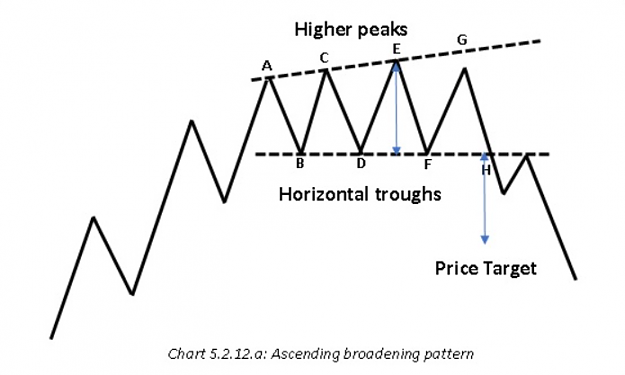
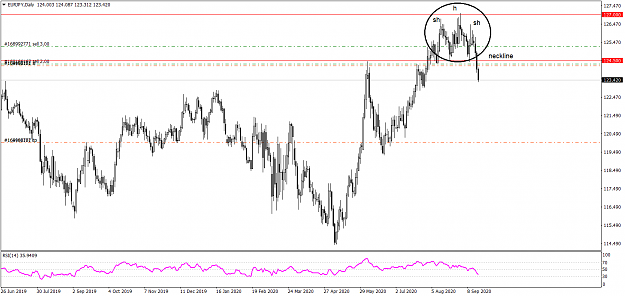
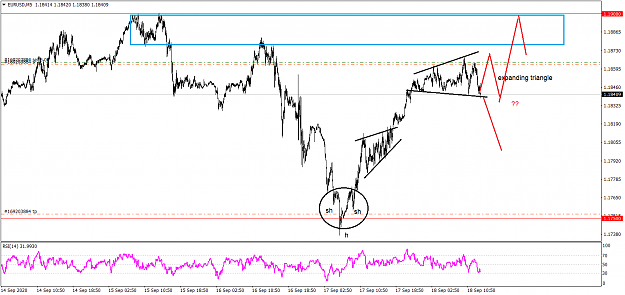
EURUSD, I'm entertaining this ascending broadening pattern {image} {image}
Ignored
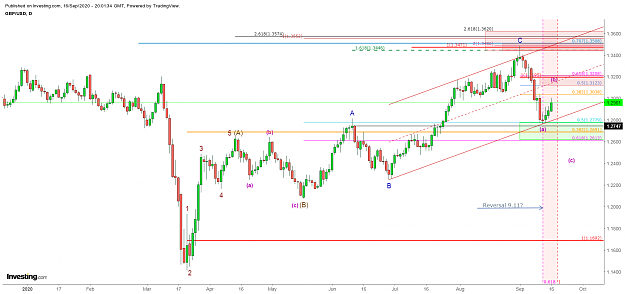
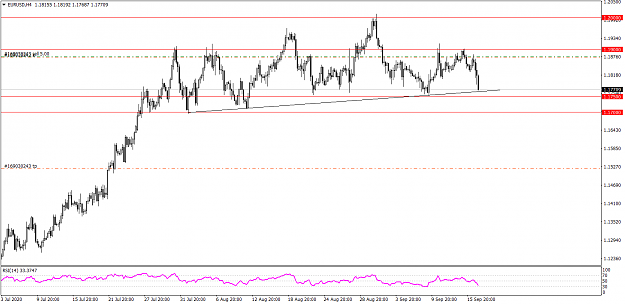
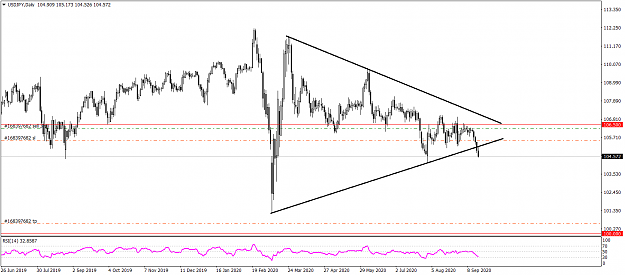
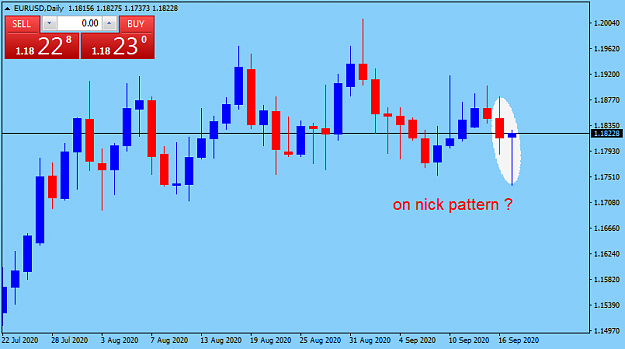
we can see a bearish continuation pattern now.
long lower wick shows us that bulls attempting a rally that ends up fizzling out on the second candle, unable to push the close above the prior candle's close. Theoretically, it is expected that the price will continue lower following the pattern.
lets see
{quote} we can see a bearish continuation pattern now. long lower wick shows us that bulls attempting a rally that ends up fizzling out on the second candle, unable to push the close above the prior candle's close. Theoretically, it is expected that the price will continue lower following the pattern. lets see {image}
Ignored
On the other hand we can see the end of a pullback
now I'm in bear camp EURUSD
{quote} we can see a bearish continuation pattern now. long lower wick shows us that bulls attempting a rally that ends up fizzling out on the second candle, unable to push the close above the prior candle's close. Theoretically, it is expected that the price will continue lower following the pattern. lets see {image}
Ignored
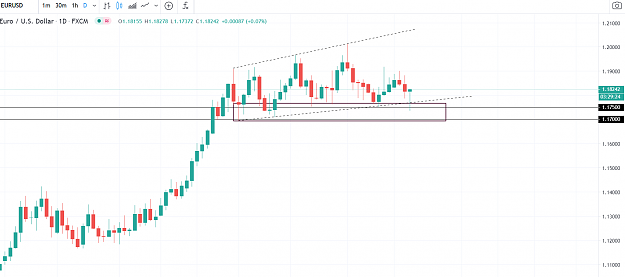
Thanks for the chart Hussin. I agree with you. I'm not sold on total a bullish scenario atm. H1/H4 seems mixed with a very subtle bearish preference. However, that daily S zone @ 1.17-1.1750 seems very well protected by big players.
Joined Jul 2009
|
Status: The Alchemist
|8,917 Posts
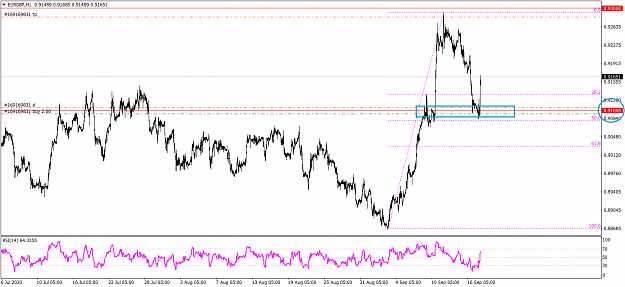
EURUSD, holding short, M5, watching this expanding triangle with a bearish bias. it is a bidirectional pattern. An upside side breakout might be limited by R zone below 1.19