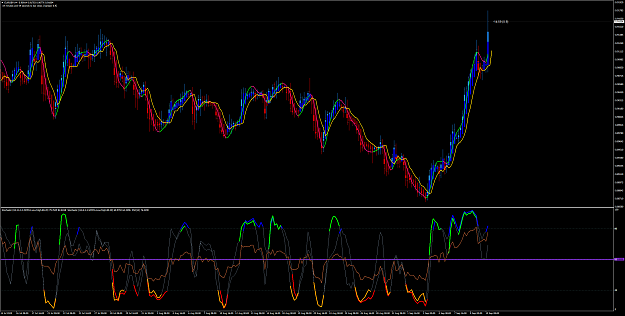
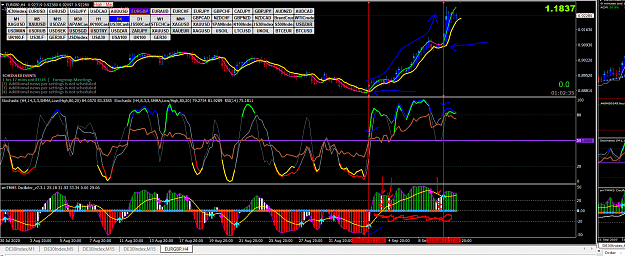
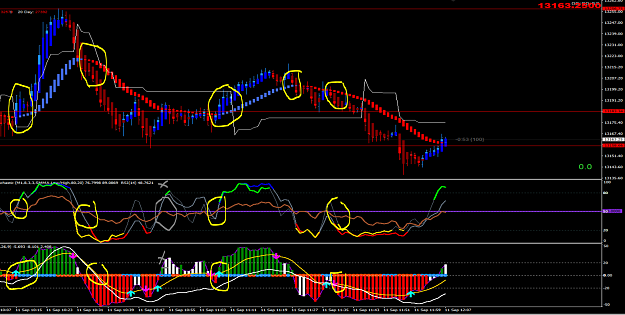
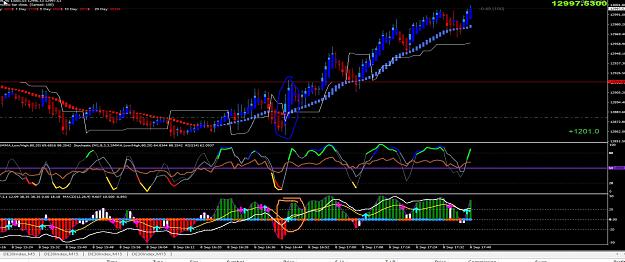
DislikedMorning Traders, Gosh in this image yesterday, Not sure how I missed it but after the rally down the SMI + MACD had already started to shift to long... {image} {image}Ignored
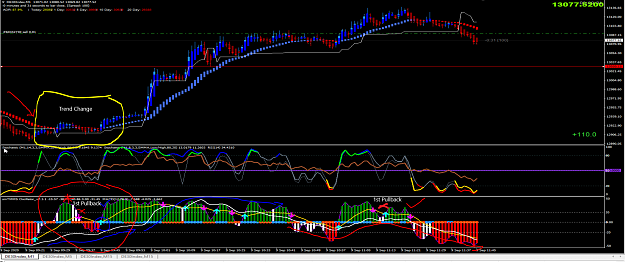
1.)If you notice from short - red histogram bars going down.... (when it manages to register decent size Blue bars on the otherside)
2.) smi and macd also start to shift during this time.... BUT they give us 1 pullback before....
3.) We see the arrow + smi + macd LINEUP in harmony "on the sweet spot" so we can start to go long on the new trend and most important visually you can see that now we have Blue/ Green histogram bars and we are going up!!!
Just some food for thought, maybe it can be of some use in your trading.
Attached Image (click to enlarge)
The more you learn, the more you see