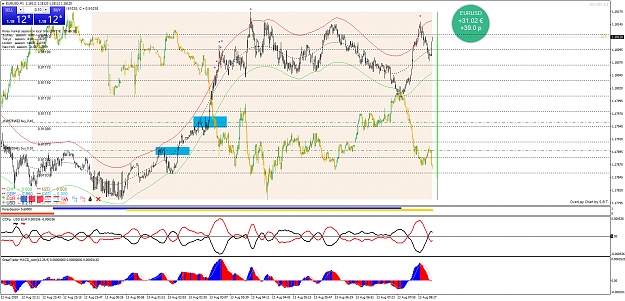
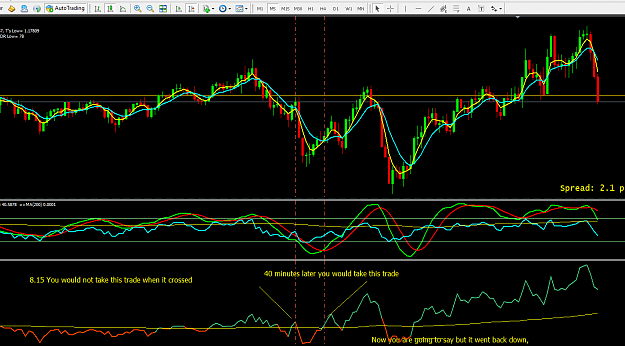
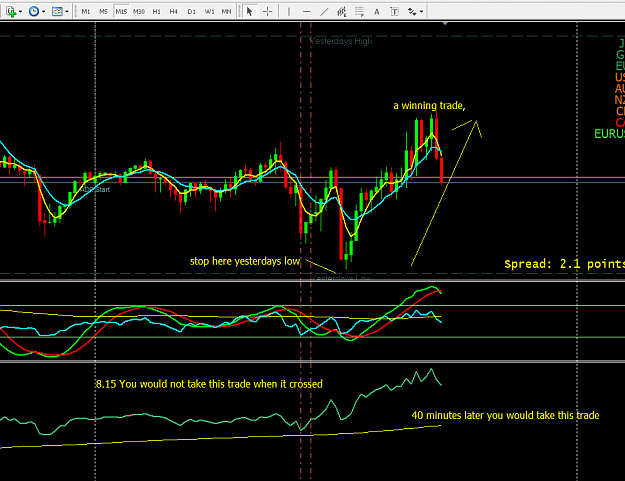
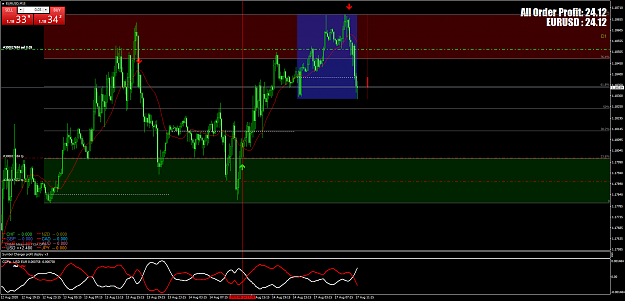
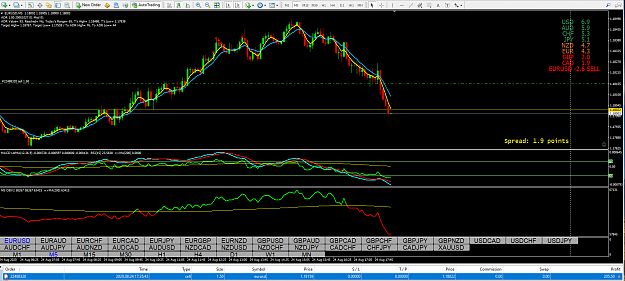
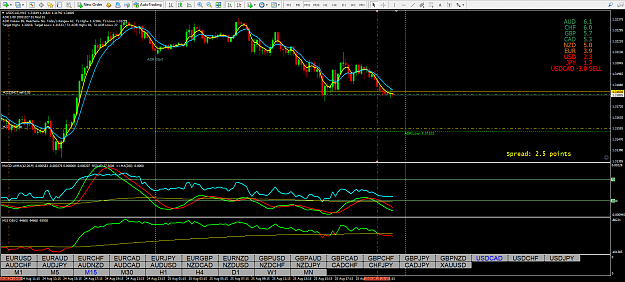
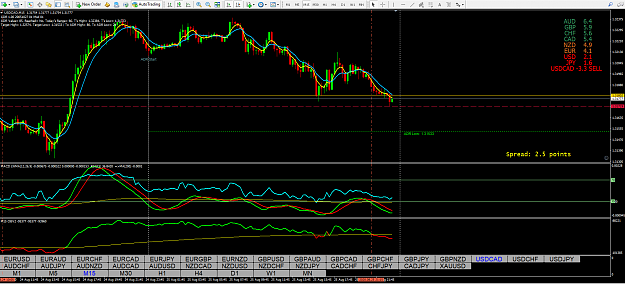
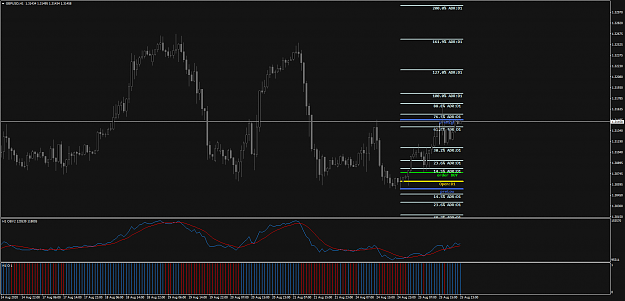
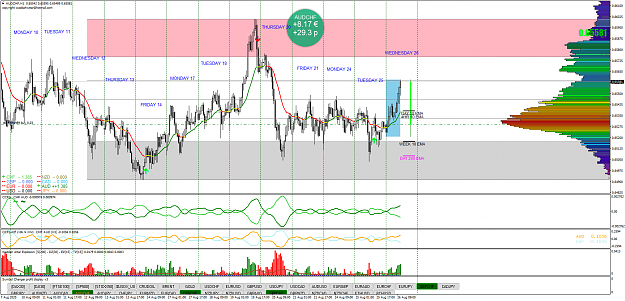
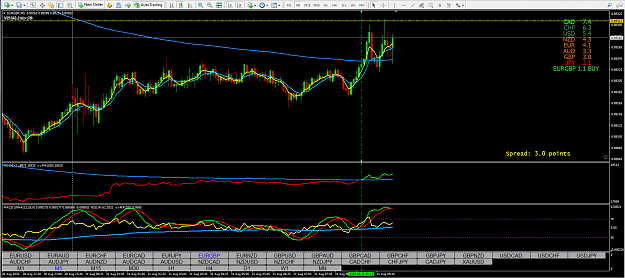
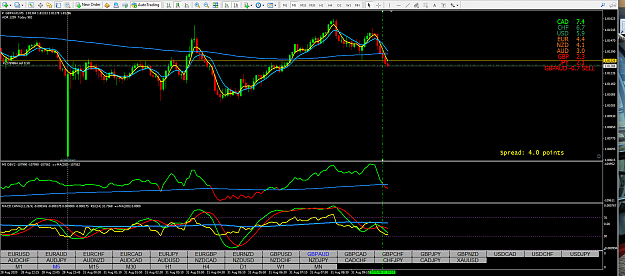
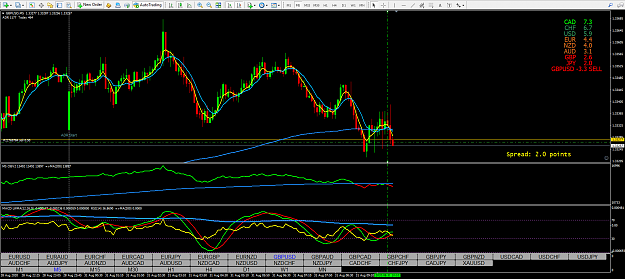
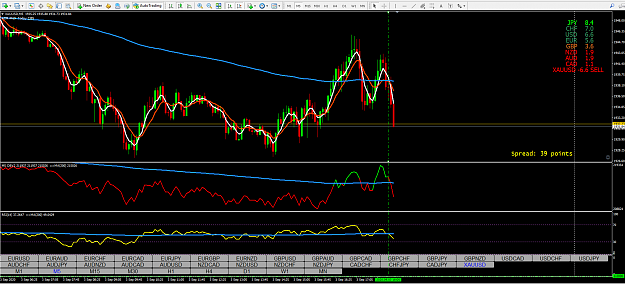
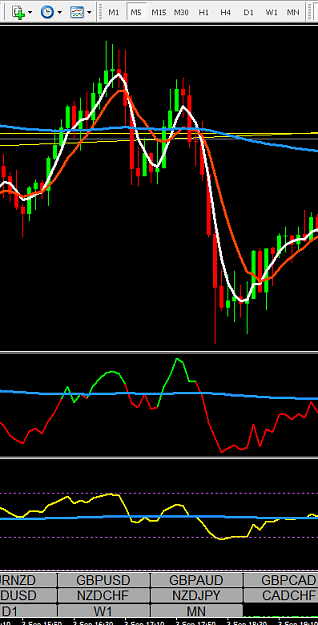
Disliked{quote} Yes it does look right and as you've downloaded it there are some instructions for you, Check out the bottom indicator the OBV the yellow line is a 200 moving exponential average, I'm using it on the 5-minute and the 15-Minute time frame it's more reliable on the 15-Minute if the blue line is above the 200 moving average you are in an uptrend it if it is below you are in a downtrend, depending on what pair you are using because it's pair crosses the moving average in the early part of the morning between 7.00 am 10.30 am I've been busy recording...Ignored
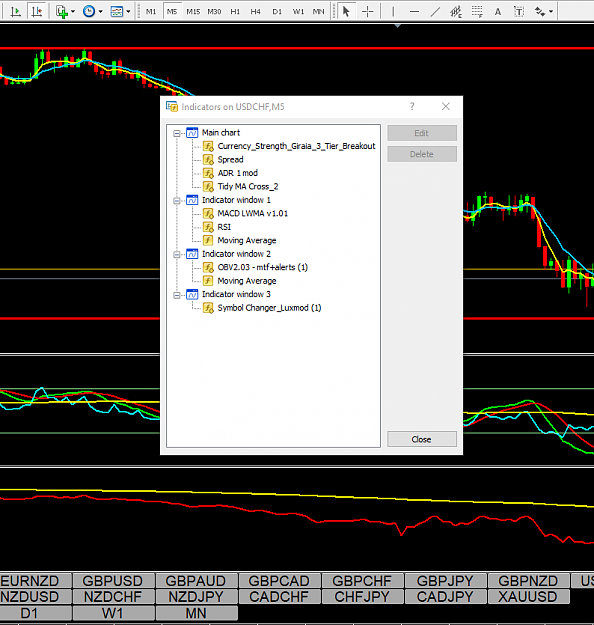
Because you wrote "OGT RSI MTF Indicator" in tpl.
sorry for my insufficient english.
so good luck and keep safe,