{quote} Ace it would be great if you could show us an example. Confluence of methods can be useful. Moreover everybody here has his own history . Hence it is 100 % "normal" that the readers and users stay with the tools they already know and trust. It is what I have done in 2006 adding Gann tools and philosophy to Hurst tools and methodology
Ignored
Parisboy,
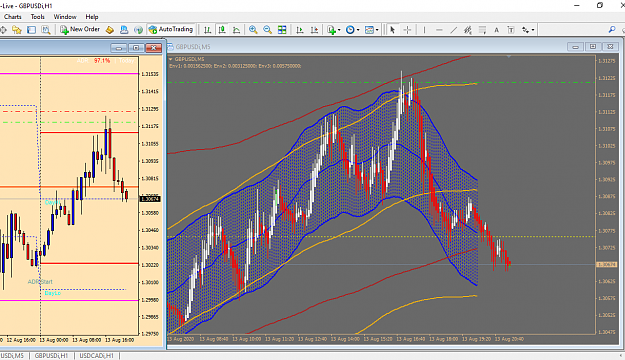
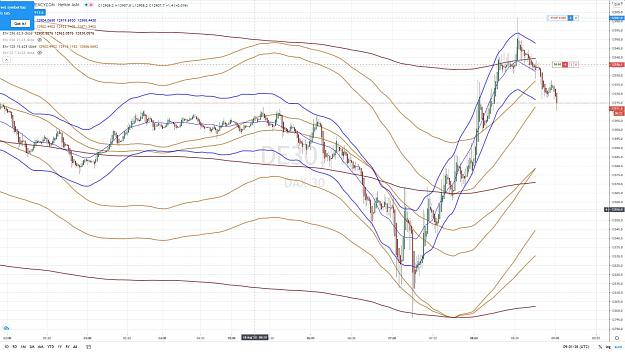
I would share my core method, but I know from past experience doing so would bring on more questions about different aspects of what I would share. I know that sounds selfish, but my other method was something I discovered after reading every post I could find by Trader Crucial Point. One post in particular put me on to what I eventually discovered so I will give him credit for the discovery. On the last chart I posted with the comments price down was rejected for a short run up then down it continues. What I do is found those what I call EXTREME POINTS. These ETREME POINTS are clearly define using the envelopes, BUT the BIG QUESTION for me has always been when will the extremes be enough to turn price in the opposite direct. The envelope will give you a good idea, but at times price will continue in its current direction. When price gets to the extreme levels & the envelopes are intersecting that is when I get more confirmation from my core method. The signals I get can be short term, but at times I will catch a bigger moves such as the one on the USD/CAD that developed after the short up turn that started on 8/11/20 & turning down on the 12th. From what Crucial Point posted he was a short term trader that used 3 indicators.
The envelopes are really all one needs to trade once you learn how to use the signals, but nothing in this business is ever 100% as it seems.
{quote} Parisboy, I would share my core method, but I know from past experience doing so would bring on more questions about different aspects of what I would share. I know that sounds selfish, but my other method was something I discovered after reading every post I could find by Trader Crucial Point. One post in particular put me on to what I eventually discovered so I will give him credit for the discovery. On the last chart I posted with the comments price down was rejected for a short run up then down it continues. What I do is found those...
Ignored
Ace
Gann, Hurst and various cycles writings , all together it is enough to occupy my time and my brain !
{quote} Ace Gann, Hurst and various cycles writings , all together it is enough to occupy my time and my brain !
Ignored
Parisboy,
I feel the same & that is what I mean by the last line in my last post. There is enough on this thread to keep one busy learning for weeks & months to come.
It is all here for the taking & very few if any indicators are needed. Those indicators by Sohocool are the best to use. His skills are spot on. I will continue to follow along on the sidelines for the most part.
Thank you for sharing your coding skills by posting many great indicators on this great thread. I care not for most of the standard indicators, but your indicators are what I call custom indicators coded for a specific use. My favor is PB_Cycles_V1.03t as it has everything needed & the parameters are changeable as desired. Best of trades to you my friend.
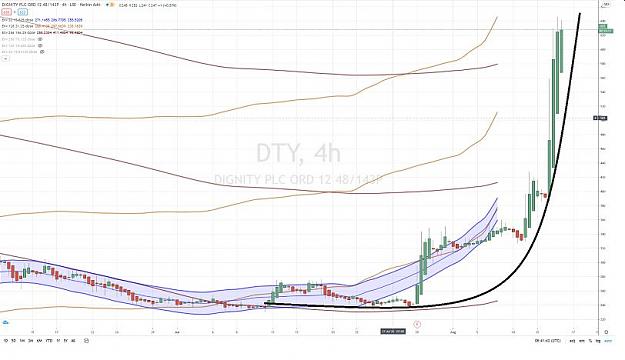
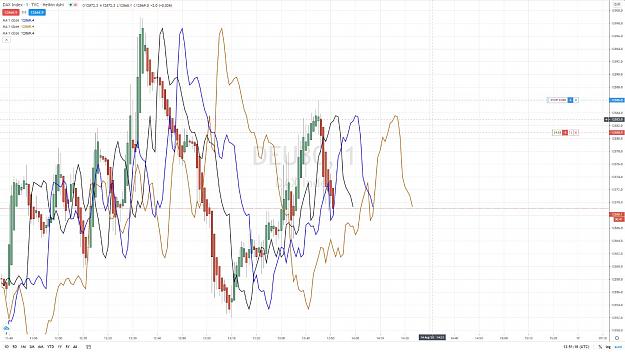
Been catching up on the last 20-odd pages of this excellent thread and noticed a request for FLD code on TV.
This is my TV indicator - there are a few things to note :
1. I wrote it specifically for bitcoin/USD.
2. Many of the variables are hard-coded to keep the settings panel as clean and simple as possible.
3. If you need to change the envelope periods go into the code and edit the appropriate time frame to match your needs.
4. The time frame of the indicator needs to be set to the same time frame as the chart or it will not function correctly.
5. There are 3 FLD's included, all of which are editable from the settings panel.
6. The fib code is not mine, but I don't remember the source !
Been catching up on the last 20-odd pages of this excellent thread and noticed a request for FLD code on TV. This is my TV indicator - there are a few things to note : 1. I wrote it specifically for bitcoin/USD. 2. Many of the variables are hard-coded to keep the settings panel as clean and simple as possible. 3. If you need to change the envelope periods go into the code and edit the appropriate time frame to match your needs. 4. The time frame of the indicator needs to be set to the same time frame as the chart or it will not function correctly....
 Analysis and Trading based on Envelopes, Waves, Cycles