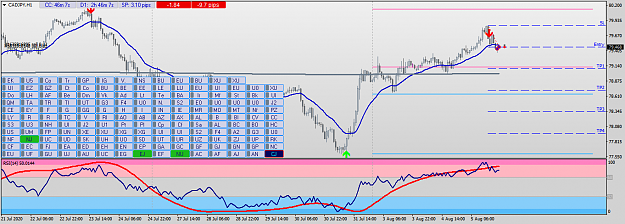
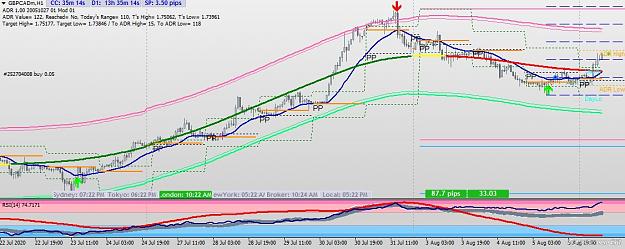
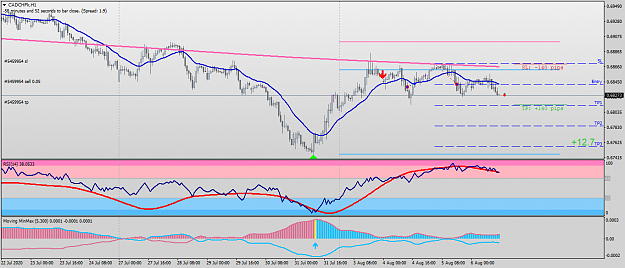
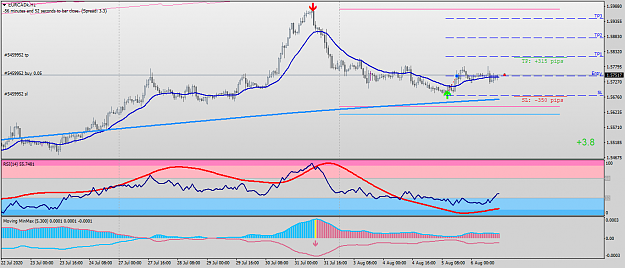
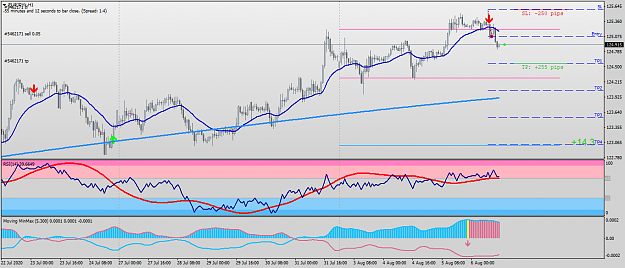
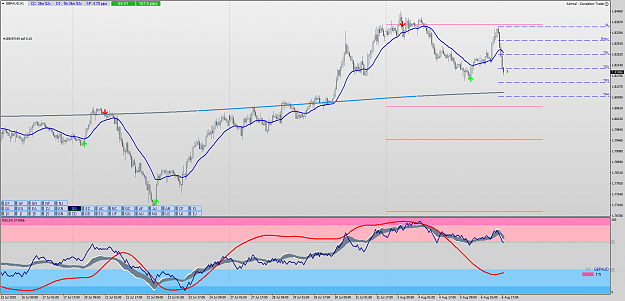
Disliked{quote} The two pink lines and 2 blue blues are marked high and low points of the previous two weeks candles,they can be used as support and resistance ,when price cross above the 2 pink lines and the rs i& moving averages makes a u turn from below ,that means the price on that instruments for the current is likely to go higher .vise-versa for blue lines. How ever if the price is above the 2 pink lines and the rsi and m/avg are up (70/80)% its either a stop hunt by Market makers or the market is trending .same goes for the 2 blue lines. If price...Ignored
well described but a shit chart set