Disliked{quote} sorry i meant to ask how does this indcator work? if we want to read the details of this indcator,where to find?Ignored
STEP 1
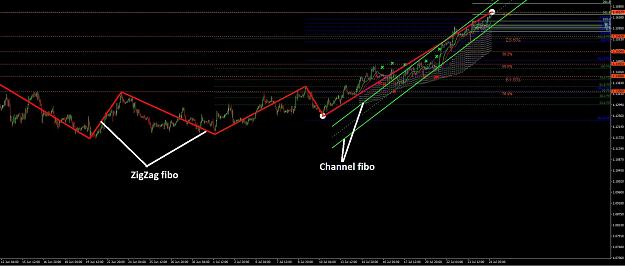
find the point zero to make sure you have to find the highest or lowest peak by moving point (A) on the indicator by hold down Shift on your keyboard along with a mouse click and hit the body of the candlesticks -1 from the lowest bars
Attached Image (click to enlarge)
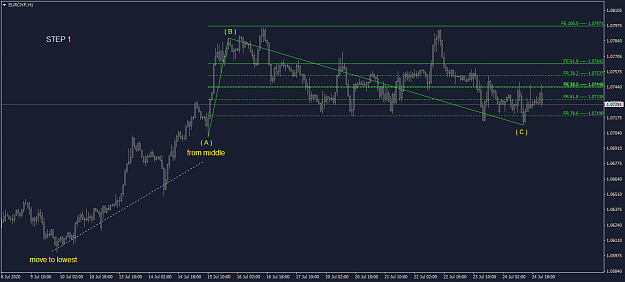
find the the highest or lowest peak by moving point ( B ) on the indicator by hold down Ctrl on your keyboard along with a mouse click and hit the body of candlesticks as the target of the peak
Attached Image (click to enlarge)
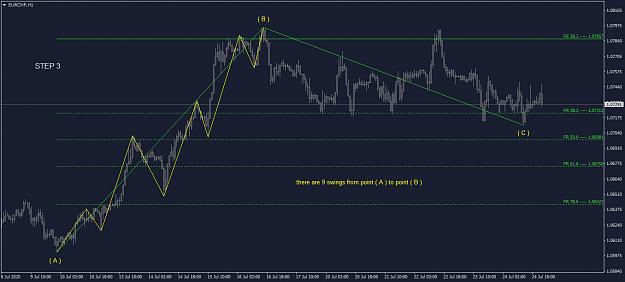
now you can see how many swings from point ( A ) to point ( B ) but the question is which point will be the sweetest spot for analysis?
Attached Image (click to enlarge)
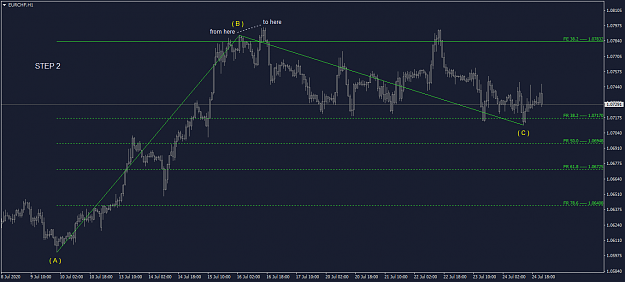
now move point (B) by hold down Ctrl on your keyboard along with a mouse click and hit the body of the candlestick gradually from the top to the bottom to find the golden ratio in point ( C )
Attached Image (click to enlarge)
as you can see point ( C ) to the highest is more longer 138.2% compared from point ( A ) to point ( B )
Attached Image (click to enlarge)
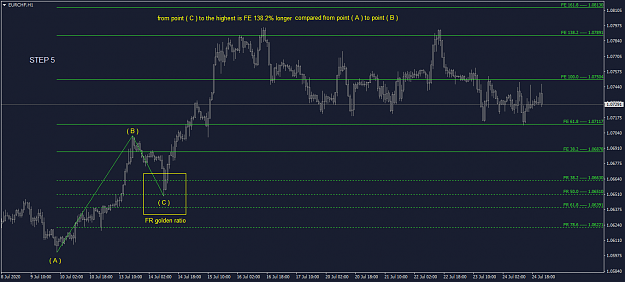
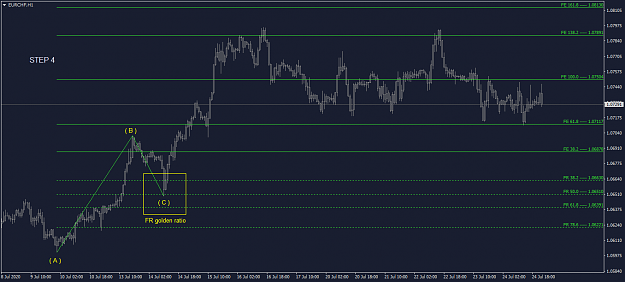
now we can make sure the highest is wave 3, why? .. because according to the elliottwaves theory wave 3 is always longer than wave 1, and make sure from point (A) to point (B) is wave 1, why? .. because wave 1 has been corrected by point ( C ) on the golden ratio FR, and we can be sure also point (C) is wave 2
Attached Image (click to enlarge)
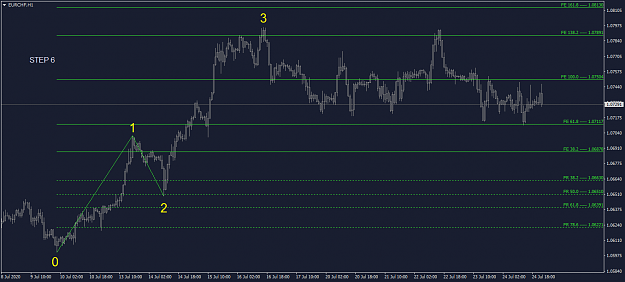
the next question is whether wave 3 is over? or can still continue to a longer level and hit more the FE level? the answer is to do measurements again from the wave 2 to the wave 3, again by using Shift, Ctrl and mouse click, as u can see prices has been entered to the golden area on FR, this indicates wave 3 has been over and you're in the wave 4
Attached Image (click to enlarge)
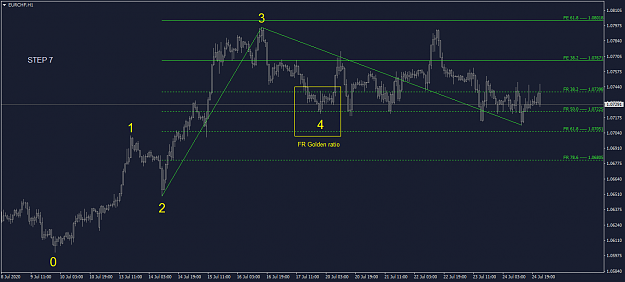
here we can see where we are, we are in wave 4, so be careful, there are two possibilities that will happen there, whether the highest is true wave 3 or it is wave ( C ) or cerrections of a bigger wave on a bullish moving and we are currently against the direction of the big bullish trend? but we don't care about that, there is a stop loss at the FR point 78.6%, because our target is trading towards to wave 5
Attached Image (click to enlarge)
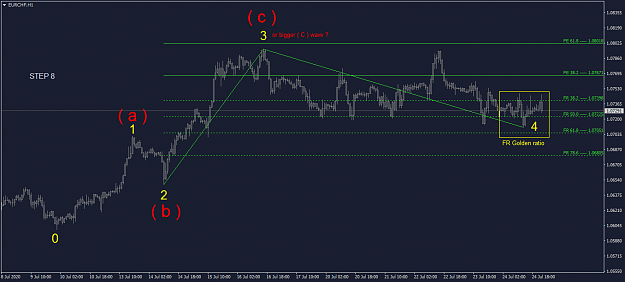
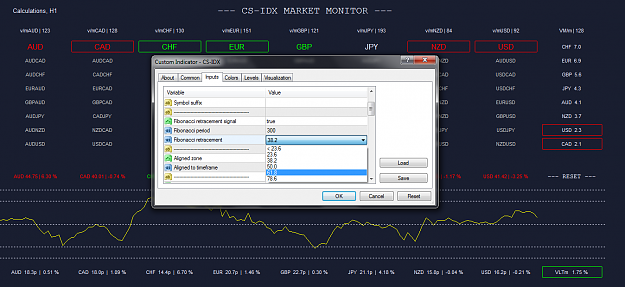
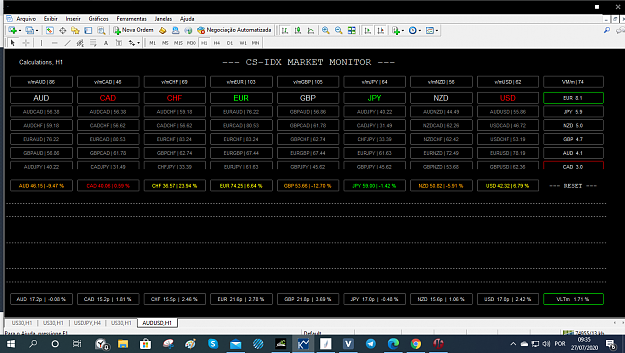
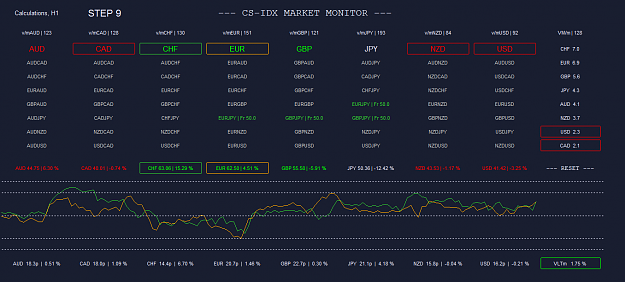
now we can do an entry point by looking at the value on CS-IDX as a reference to the strength of the currency at the time, is feasible to be executed or not, as u can see EUR move to the strong zone and i will take the risk
Attached Image (click to enlarge)
move the point (A) on the indicator back returns to the beginning of wave 1, after that determine entry points, SL and TP.
Attached Image (click to enlarge)
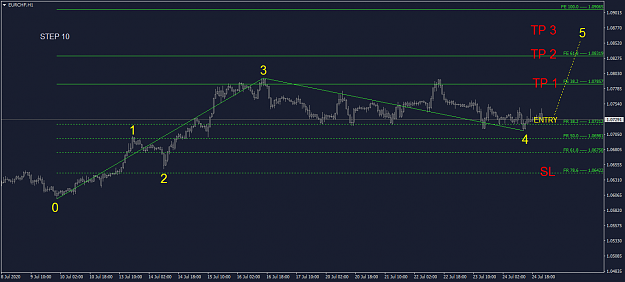
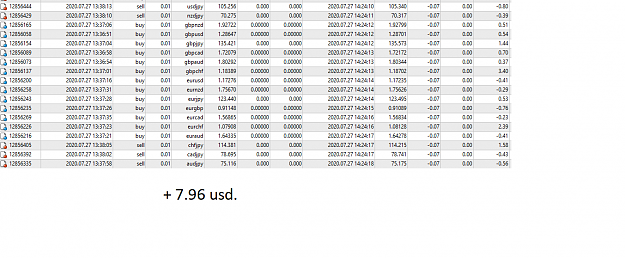
job has done!
for the record all this is not easy to be understanding, need alot of time to be understand, if it is easy everyone will do it! but at least you now have new knowledge as a basis for learning on understanding the market patterns and elliottwaves movement.
hope thats answered the questions
4