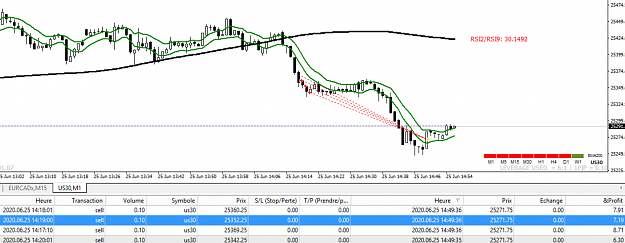
Managed to get in on the EU
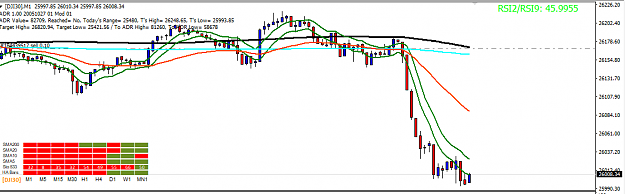
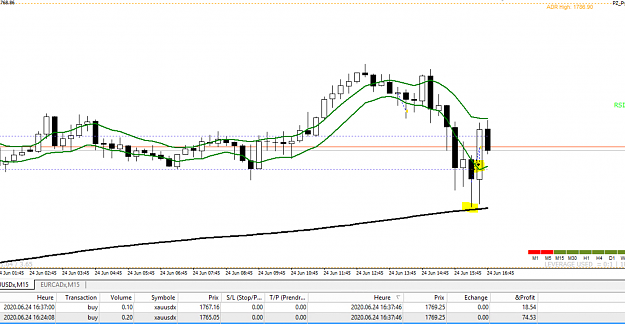
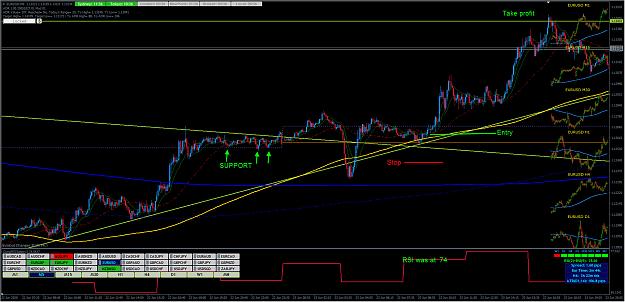
1st image is of the 5m chart. You can see to the left support formed around 1.12534 (Green Arrows). Price seems to support both the downward trend line and upward trend line. We are above 15m,30m,4H, D1 SMA's and just just crossing the 1H and 5M SMA's. RSI at 74 and.... were bouncing off the 200SMA of the 5 minute chart which was where i placed this entry. So that's 6+ things in our favor .Yellow line is the current Time frame 200SMA (5 Minute). The dashed red line is the 200SMA of a lower degree(1 minute), Dashed blue line is the 200SMA of the higher degree (15 minute) and the solid blue is two degrees higher (30 minute). The additional SMA's are not part of the road map but it helps me visualize other time frames without having to switch back and forth and also aid in spotting entries on other time frames. 2nd and 3rd pictures are looking at the higher time frames and you can see where the trendiness and target came from.
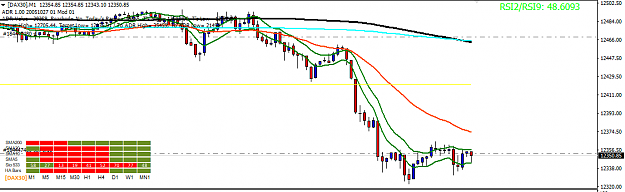
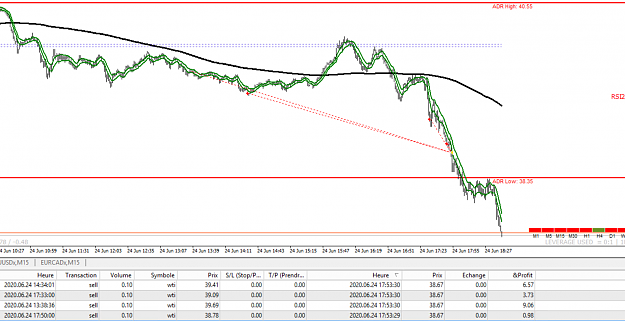
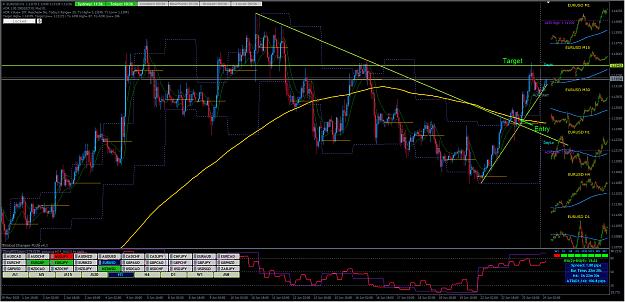
2nd image is looking at the bigger picture with the 1 hour chart
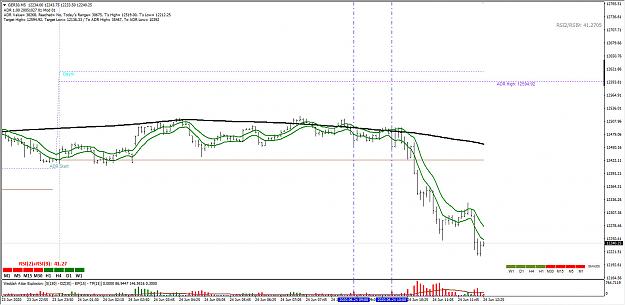
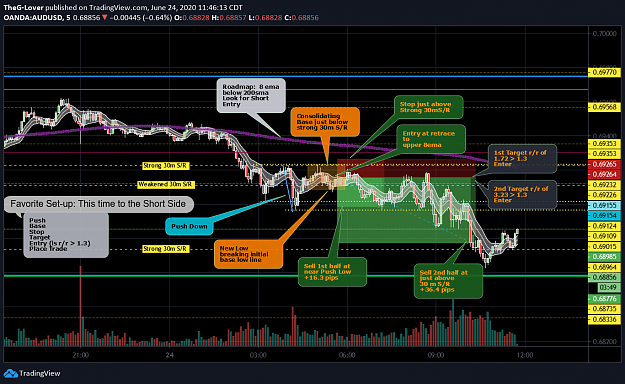
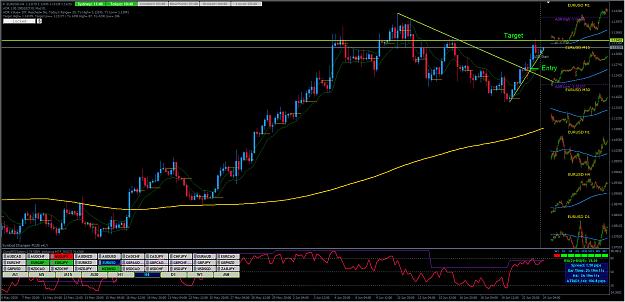
3rd image is looking at the bigger picture with the 4 hour chart
1st image is of the 5m chart. You can see to the left support formed around 1.12534 (Green Arrows). Price seems to support both the downward trend line and upward trend line. We are above 15m,30m,4H, D1 SMA's and just just crossing the 1H and 5M SMA's. RSI at 74 and.... were bouncing off the 200SMA of the 5 minute chart which was where i placed this entry. So that's 6+ things in our favor
Attached Image (click to enlarge)
2nd image is looking at the bigger picture with the 1 hour chart
Attached Image (click to enlarge)
3rd image is looking at the bigger picture with the 4 hour chart
Attached Image (click to enlarge)
5