{quote} Hi Tonberry Just a heads up what I do, I just go down to lower TF's that is trade-able, yesterday and today I am on the 15 and 30 min but just trading pivot to pivot.
When I enter a trade when the oscillator crosses I have mostly losses? What can I do about it?
Ignored
Just my 2 cents worth, treat the template and all the indicators as a signal service but only enter a trade if price is coming off a support / resistance area or a pivot. Price coming off a solid supply or demand zone is also good. Don't chase those sudden price moves, they are just there to trap you.
{quote} Just my 2 cents worth, treat the template and all the indicators as a signal service but only enter a trade if price is coming off a support / resistance area or a pivot. Price coming off a solid supply or demand zone is also good. Don't chase those sudden price moves, they are just there to trap you.
Ignored
Okey! Thanks for the valuable information! Are you using indicators for the S/R or just manually?
When I enter a trade when the oscillator crosses I have mostly losses? What can I do about it?
Ignored
Create your own trading strategy if you wanna succeed, something which might work for someone might not work for you, in trading there are so many factors which determine the success and the failure.
If what you are following isn't giving you profit, it means that you should change strategy...
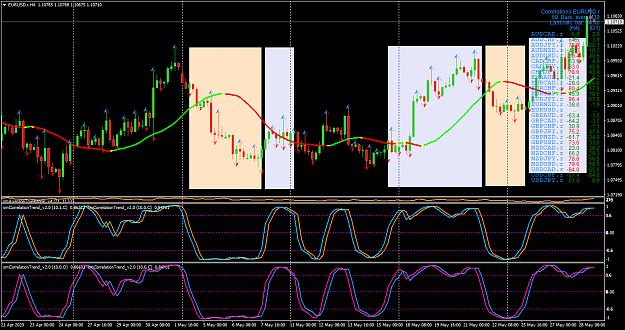
For tests only: "smCorrelationTrend_v1.0" My old friend John Ehlers published a correlation indicator in the last issue of "Stocks & Commodities" (May 2020), based on the Spearman correlation. Because I posted here in forum a MultiPairs indicator based on the Pearson correlation, I wrote for John a MT4 version ... Maybe someone would like to test or use the indicator. {image} {file} {image}
Ignored
Thanks SwingMan,
very interesting indi. Have to test later but the first impression is very good.
[quote=neil001;12964700]{quote} Hi Marcus - Your post raises some questions and I'll see if I can verbalise them :/ - please note
..
Hi Neil,
1. One definitely needs to have a feeling of R:R but I dont let that distract me from locking in profit... I'll happily bank 10pips even though my stop loss was -50. But that's just me. Hopefully traders will decide what their own understanding is on R:R and locking in of profit.
2. Most definitely in an ideal world, let your winners run (even open multiple positions to increase profit on a well performing asset if the indicators are showing very strong RSI and breakouts across atleast 2 or 3 timeframes) but most trades dont afford such a luxury on a daily basis), so I'm a lateral and logical thinker therefore my approach has evolved against what you've read as the norm. I've read the books...
3. Think I answered in num one, you may have misunderstood my suggestion.
4. I think you've missed my posts of previously weekly trading results shared, otherwise youd know I trade most forex assets on that Monday I just chose to trade those assets they were setup perfectly.
Cheers bud.
New version "smCorrelationTrend_v2.0" Here is a small addition: - one can shift the line (as in subchart 1) - one can take different prices into account (Open and Close as in subchart 2) (The manually drawn areas correspond to the crossing of the indicator with the 0 line) {image} {file}
{quote} Dear SWING MAN, Good day, May you explain how to use this correlation ? Thanks in advance,... Best Regards, Budi Dharma
Ignored
Hey,
SwingMan gave you all you need already. Read the article he attached and you will understand.
Overlay the 10, the 20 and the 40 on your chart and you will see.
No further explaination necessary.
New version "smCorrelationTrend_v2.0" Here is a small addition: - one can shift the line (as in subchart 1) - one can take different prices into account (Open and Close as in subchart 2) (The manually drawn areas correspond to the crossing of the indicator with the 0 line) {image} {file}
Ignored
Hello
First let me thank Swingman and I am using this new index instead of Stoch 8.3,3! Next I found the index 10 to be quite good on the H4 time frame. I am still learning more about this indicator and how to use it in combination with the first sample of RH!
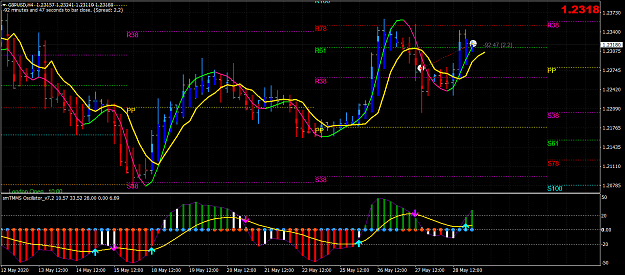
Good Morning everyone,
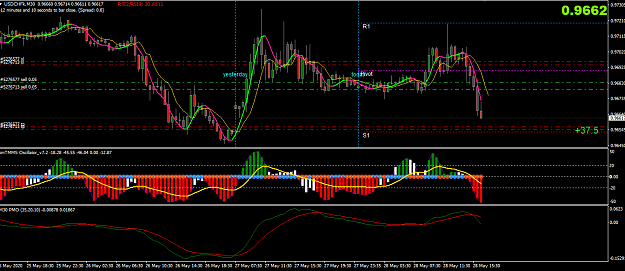
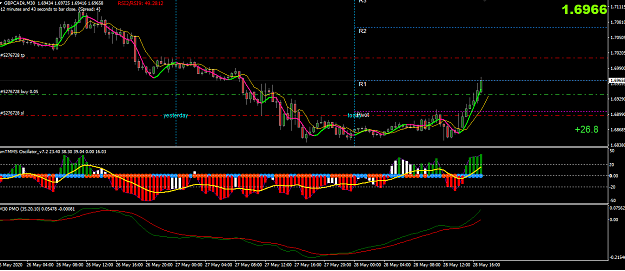
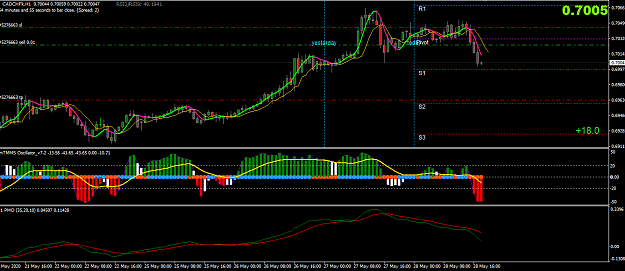
just to share that the combination of this two (pivots + TMS) works perfect for me last 4 weeks. with 2-3 % risk, gain was 17%. I'm entering on 1 hour. My personal opinion is that 4H is too late. My most important entries and best deals so far are the first entries for the week on Monday from around the pivot towards main trend on 4H and D.Best regard and stay green.