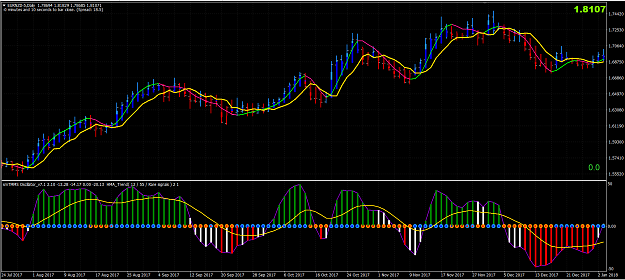
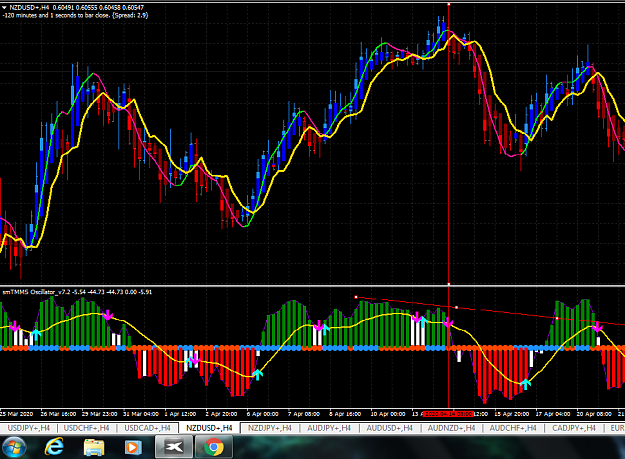
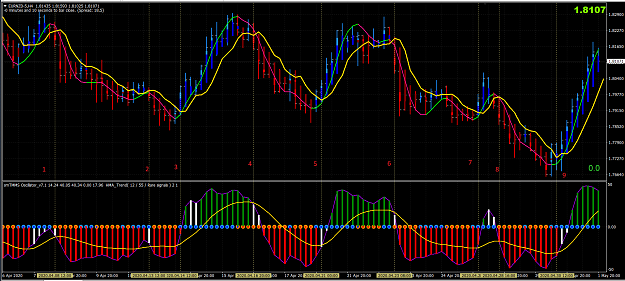
• Home
  • Forums
  • Trades
  • News
  • Calendar
  • Market
  • Brokers
  • Login
  • Join
  • User/Email: Password:
  • 4:33pm
Menu
  • Forums
  • Trades
  • News
  • Calendar
  • Market
  • Brokers
  • Login
  • Join
  • 4:33pm
Sister Sites
  • Metals Mine
  • Energy EXCH
  • Crypto Craft

Options

Bookmark Thread

First Page First Unread Last Page Last Post

Print Thread

Similar Threads

Trading Made Simple 133,652 replies

Trading Made Simple the right way, and other trading lessons 320 replies

MTF Indicators for the 'Trading Made Simple' system 240 replies

Indicators for the 'Trading Made Simple' system 342 replies

Trading Made Simple system follower - Thanks to eelfranz 9 replies

  • Trading Systems
  • /
  • Reply to Thread
  • Subscribe
  • 3,839
Attachments: Trading Made Simple(r)
Exit Attachments

Trading Made Simple(r)

  • Last Post
  •  
  • 1 254255Page 256257258 416
  • 1 Page 256 416
  •  
  • Post #5,101
  • Quote
  • May 3, 2020 5:15am May 3, 2020 5:15am
  •  jan.forex
  • | Joined Jul 2019 | Status: Member | 74 Posts
Quoting RobinHood
Disliked
These are my current templates. This one shows the arrows in the bottom when window the Yellow Line crosses the DarkViolet Line. {file} {image} This one does not show the arrows. {file} {image} Use whichever one appeals to you most.
Ignored
Hi RobinHood - first time I'm using these templates. I understand the rules as explained in your first post but what are they for the new template you using?
 
 
  • Post #5,102
  • Quote
  • May 3, 2020 5:21am May 3, 2020 5:21am
  •  zzzzz
  • | Joined Mar 2019 | Status: Member | 22 Posts
Quoting jan.forex
Disliked
{quote} Hi RobinHood - first time I'm using these templates. I understand the rules as explained in your first post but what are they for the new template you using?
Ignored
Try reading from page 137
 
1
  • Post #5,103
  • Quote
  • May 3, 2020 5:31am May 3, 2020 5:31am
  •  Celal
  • | Joined Sep 2017 | Status: Member | 255 Posts
Hi RobinHood,
I want to ask someting. Firstly the set up candle was: RSI(14) and stoch(14,3,3) and stoch(8,3,3) are bigger than 50, and crossing of EMA(5,2sh) and Hull MA(13.3) . Than you add stochastic Momentum(10,10,10).
1)So did you change the place of the set up candle?
2)If STOCH(14,3,3) crosses SMI(10,10,10), is this candle new setup candle or you wait the the crossing of EMA(5,2) and HullMA(13.3) ?
3)In two positions the condition of RSI(14)>=50 must be valid or not?
Usually STOCH(14,3,3) and SMI(10,10,10) crosses before RSI(14)>50 (crosses), but we can not sure trend direction.
 
 
  • Post #5,104
  • Quote
  • May 3, 2020 7:45am May 3, 2020 7:45am
  •  RobinHood
  • Joined Jul 2009 | Status: Trade What U See Not What You Think | 1,299 Posts
Hi RobinHood,

I want to ask someting. Firstly the set up candle was: RSI(14) and stoch(14,3,3) and stoch(8,3,3) are bigger than 50, and crossing of EMA(5,2sh) and Hull MA(13.3)

The Hull MA is 12, 3

Than you add stochastic Momentum(10,10,10).

Yes, but I changed it to 9, 9, 9

1)So did you change the place of the set up candle?

No

2)If STOCH(14,3,3) crosses SMI(10,10,10), is this candle new setup candle or you wait the the crossing of EMA(5,2) and HullMA(13.3) ?

Those are 2 different signals and they are completely independent of each other.

3)In two positions the condition of RSI(14)>=50 must be valid or not?

Yes, ideally.

Usually STOCH(14,3,3) and SMI(10,10,10) crosses before RSI(14)>50 (crosses), but we can not sure trend direction.

I don't trade using each indicator separately in the lower window anymore on MT4. I use the smTMMS Oscillator v7.1, the HMA Trend and the SMI 9, 9, 9. See the chart example below:

Attached Image (click to enlarge)
Click to Enlarge

Name: Chart v7.1.PNG
Size: 95 KB
Always a Student, Never a Master - Emulate What Works
 
 
  • Post #5,105
  • Quote
  • May 3, 2020 7:59am May 3, 2020 7:59am
  •  Wyrebill
  • | Joined Mar 2020 | Status: Member | 70 Posts
Quoting 40PipsAlan
Disliked
{quote} Have you disabled draw vertical lines in the oscillator settings?
Ignored


Thank you
 
 
  • Post #5,106
  • Quote
  • May 3, 2020 8:02am May 3, 2020 8:02am
  •  Wyrebill
  • | Joined Mar 2020 | Status: Member | 70 Posts
Quoting SwingMan
Disliked
{quote} If you have time, you can learn more about the objects in Metatrader by reading the documentation. You just have to click on the lines (objects) and press the delete key ... New version "smTMMS Oscillator_v7.2" @Wyrebill had the good idea to have fewer vertical lines in the chart, for various reasons. In the new version one can change the mode of the lines (ALL, BUY, SELL) and the total number of lines. Example: Draw_Vertical_Lines = true ; Mode_Vertical_Lines = BUY; NumberOf_VerticalLines= 4; {quote} OK, I have activated the settings in...
Ignored
Thank you.
 
 
  • Post #5,107
  • Quote
  • May 3, 2020 8:31am May 3, 2020 8:31am
  •  Jonhathan123
  • | Joined Apr 2020 | Status: Member | 117 Posts
Quoting RobinHood
Disliked
Hi RobinHood, I want to ask someting. Firstly the set up candle was: RSI(14) and stoch(14,3,3) and stoch(8,3,3) are bigger than 50, and crossing of EMA(5,2sh) and Hull MA(13.3) The Hull MA is 12, 3 Than you add stochastic Momentum(10,10,10). Yes, but I changed it to 9, 9, 9 1)So did you change the place of the set up candle? No 2)If STOCH(14,3,3) crosses SMI(10,10,10), is this candle new setup candle or you wait the the crossing of EMA(5,2) and HullMA(13.3) ? Those are 2 different signals and they are completely independent of each other. 3)In two...
Ignored
I have a positive idea: That is using the current time frame + higher rsi time frame to trade time. For example h4 frame with full signals for sell as samples + index rsi d1 <50 I will enter sell. Is it possible, sir?
 
 
  • Post #5,108
  • Quote
  • May 3, 2020 8:48am May 3, 2020 8:48am
  •  RobinHood
  • Joined Jul 2009 | Status: Trade What U See Not What You Think | 1,299 Posts
Quoting Jonhathan123
Disliked
{quote} I have a positive idea: That is using the current time frame + higher rsi time frame to trade time. For example h4 frame with full signals for sell as samples + index rsi d1 <50 I will enter sell. Is it possible, sir?
Ignored
You could do that, but then you are going to miss a lot of trades. I only care about "1 time frame higher" because, ideally, I want to trade in the same direction as it is going.
Always a Student, Never a Master - Emulate What Works
 
 
  • Post #5,109
  • Quote
  • May 3, 2020 8:51am May 3, 2020 8:51am
  •  Jonhathan123
  • | Joined Apr 2020 | Status: Member | 117 Posts
Quoting RobinHood
Disliked
{quote} You could do that, but then you are going to miss a lot of trades. I only care about "1 time frame higher" because, ideally, I want to trade in the same direction as it is going.
Ignored
Thanks!!! I will practice more
 
 
  • Post #5,110
  • Quote
  • Edited at 10:16am May 3, 2020 9:28am | Edited at 10:16am
  •  RobinHood
  • Joined Jul 2009 | Status: Trade What U See Not What You Think | 1,299 Posts
I don't think that most visitors to this thread have taken the time to try to REALLY, REALLY, REALLY UNDERSTAND the power of the indicators that I have presented and their synergy. If you will take the time to really study this template, you will find that it can tell you about 15-20 different pieces of information that I can easily think of.

For example, take time to study the vertical dotted lines that I have placed on the chart below. Start connecting the different information you see from the indicators together and you'll soon see a vivid picture of information. Once you REALLY see what the chart is telling you, you will realize that you cannot "un-see" it. And that's exactly what you want. Like riding a bicycle without giving it any thought while you are riding it.

Then, go deeper....

Look for divergence using the purple line in the lower window, and see what that may be foretelling of.

Look at the momentum using the purple and yellow lines in the lower window, and see what that may be foretelling of.

Look at when you get an entry signal at whether the bar has an up or down close, and why that's important.

Look at the time(s) of day when the market "moves" tending to trend, and what time(s) it doesn't.

Look at how many indicators are in agreement at the same time, and learn when you can ignore the one(s) that aren't in agreement.

I could go on and on, but I don't want to just spoon feed everything to everybody. The point I am trying to get you to realize is there is A LOT more information to be garnered than just what you see on the surface of the chart. REALLY, REALLY IMPORTANT INFORMATION!

But to gain this "understanding", YOU HAVE TO REALLY, REALLY STUDY THE CHARTS until the information you see can always be seen INSTANTLY, and without any strainful effort.
Attached Image (click to enlarge)
Click to Enlarge

Name: EN Daily.PNG
Size: 131 KB
Always a Student, Never a Master - Emulate What Works
 
7
  • Post #5,111
  • Quote
  • May 3, 2020 9:56am May 3, 2020 9:56am
  •  Celal
  • | Joined Sep 2017 | Status: Member | 255 Posts
Hi RobinHood,
Thank you very much.
 
 
  • Post #5,112
  • Quote
  • May 3, 2020 10:12am May 3, 2020 10:12am
  •  mubinirl
  • | Joined Jul 2012 | Status: They All come back to point zero. | 208 Posts
Quoting RobinHood
Disliked
I don't think that most visitors to this thread have taken the time to REALLY, REALLY, REALL{image}
Ignored
Well Said RH. It amazes me how humble you are in answering new comers who dont bother to read & spend time. I have taken your approach & integrated into my system and hv started live trading with never before like results. Thanks for this simple dashboard.
Be the change that you want to change
 
 
  • Post #5,113
  • Quote
  • May 3, 2020 10:15am May 3, 2020 10:15am
  •  RobinHood
  • Joined Jul 2009 | Status: Trade What U See Not What You Think | 1,299 Posts
Quoting mubinirl
Disliked
{quote} Well Said RH. It amazes me how humble you are in answering new comers who dont bother to read & spend time. I have taken your approach & integrated into my system and hv started live trading with never before like results. Thanks for this simple dashboard.
Ignored
You're welcome!
Always a Student, Never a Master - Emulate What Works
 
 
  • Post #5,114
  • Quote
  • May 3, 2020 10:59am May 3, 2020 10:59am
  •  Jonhathan123
  • | Joined Apr 2020 | Status: Member | 117 Posts
Quoting RobinHood
Disliked
I don't think that most visitors to this thread have taken the time to try to REALLY, REALLY, REALLY UNDERSTAND the power of the indicators that I have presented and their synergy. If you will take the time to really study this template, you will find that it can tell you about 15-20 different pieces of information that I can easily think of. For example, take time to study the vertical dotted lines that I have placed on the chart below. Start connecting the different information you see from the indicators together and you'll soon see a vivid picture...
Ignored
bother, can you see if this helps me to see the divergence of the purple line?
I'm not good at finding out divergences.
Attached Image (click to enlarge)
Click to Enlarge

Name: test.png
Size: 109 KB
 
 
  • Post #5,115
  • Quote
  • May 3, 2020 11:06am May 3, 2020 11:06am
  •  RobinHood
  • Joined Jul 2009 | Status: Trade What U See Not What You Think | 1,299 Posts
Quoting Jonhathan123
Disliked
{quote} bother, can you see if this helps me to see the divergence of the purple line? I'm not good at finding out divergences. {image}
Ignored
That's one, plus there are several more on that chart.
Always a Student, Never a Master - Emulate What Works
 
 
  • Post #5,116
  • Quote
  • May 3, 2020 11:11am May 3, 2020 11:11am
  •  Jonhathan123
  • | Joined Apr 2020 | Status: Member | 117 Posts
Quoting RobinHood
Disliked
{quote} That's one, plus there are several more on that chart.
Ignored
I am still continuing to dig in depth as you have just pointed out.
The momentum has crossed the purple line, but the closing candle does not cross MA 5 Shift 2 and HMA has not crossed MA 5 Shift 2 on the current chart, right?
If wrong, hope you only let me learn from experience!
 
 
  • Post #5,117
  • Quote
  • May 3, 2020 11:27am May 3, 2020 11:27am
  •  RobinHood
  • Joined Jul 2009 | Status: Trade What U See Not What You Think | 1,299 Posts
Quoting Jonhathan123
Disliked
{quote} I am still continuing to dig in depth as you have just pointed out. The momentum has crossed the purple line, but the closing candle does not cross MA 5 Shift 2 and HMA has not crossed MA 5 Shift 2 on the current chart, right? If wrong, hope you only let me learn from experience!
Ignored
The momentum IS the based on purple line. When it is above the yellow line, the momentum is up. When it is below the yellow line, the momentum is down.

As far as the candles crossing the 5 ema, and the HMA not crossing it, there are MANY ways on the chart I showed to get in or out of the market. You must decide which ways look to be the best ways to you because YOU have to have confidence in how you make your trading decisions.

Again, with no rudeness intended, I do not want to spoon feed everyone as to exactly how to trade. I want THEM to figure these things out. Do that, present what you think and I will give you my opinion if you ask.
Always a Student, Never a Master - Emulate What Works
 
1
  • Post #5,118
  • Quote
  • May 3, 2020 11:29am May 3, 2020 11:29am
  •  Jonhathan123
  • | Joined Apr 2020 | Status: Member | 117 Posts
Quoting RobinHood
Disliked
{quote} The momentum IS the based on purple line. When it is above the yellow line, the momentum is up. When it is below the yellow line, the momentum is down. As far as the candles crossing the 5 ema, and the HMA not crossing it, there are MANY ways on the chart I showed to get in or out of the market. You must decide which ways look to be the best ways to you because YOU have to have confidence in how you make your trading decisions. Again, with no rudeness intended, I do not want to spoon feed everyone as to exactly how to trade. I want THEM...
Ignored
I will try! Thank you very much!!!
 
 
  • Post #5,119
  • Quote
  • May 3, 2020 11:51am May 3, 2020 11:51am
  •  dbsys
  • | Joined Jun 2009 | Status: Member | 160 Posts
Quoting RobinHood
Disliked
I don't think that most visitors to this thread have taken the time to try to REALLY, REALLY, REALLY UNDERSTAND the power of the indicators that I have presented and their synergy. If you will take the time to really study this template, you will find that it can tell you about 15-20 different pieces of information that I can easily think of. For example, take time to study the vertical dotted lines that I have placed on the chart below. Start connecting the different information you see from the indicators together and you'll soon see a vivid picture...
Ignored
Ok, I will try to write what I can see on your chart with lines.

1. Bar changed color, possible direction change, also HMA changed color, but bar needs to close to confirm that, also for Oscillator same.

2. Here I don't see nothing that my eyes can see. Just after bar close continuation trade.

3. Bar changed color, momentum crossed to upside, HMA after bar close confirms up move.

4. HMA is down, momentum crossed to down side, after bar close down confirmation.

5. HMA changed to up, bar confirmed up move.

6. Crossover trade, momentum is down, HMA after bar close confirms move change.

7. Momentum crossed up, HMA changed color to up, after bar close bar changes color for up move.

8. Bar changed color, after bar close HMA changes move to down, Oscillator is down also.

9. HMA and Bar changed to up side move.

RH, you comments are welcome
Attached Image (click to enlarge)
Click to Enlarge

Name: EN Daily.PNG
Size: 97 KB
 
 
  • Post #5,120
  • Quote
  • May 3, 2020 12:02pm May 3, 2020 12:02pm
  •  RobinHood
  • Joined Jul 2009 | Status: Trade What U See Not What You Think | 1,299 Posts
Quoting dbsys
Disliked
{quote} Ok, I will try to write what I can see on your chart with lines. 1. Bar changed color, possible direction change, also HMA changed color, but bar needs to close to confirm that, also for Oscillator same. 2. Here I don't see nothing that my eyes can see. Just after bar close continuation trade. 3. Bar changed color, momentum crossed to upside, HMA after bar close confirms up move. 4. HMA is down, momentum crossed to down side, after bar close down confirmation. 5. HMA changed to up, bar confirmed up move. 6. Crossover trade, momentum is down,...
Ignored
Those are all good observations. Now focus on what the white bars in the lower window might be telling you.
Always a Student, Never a Master - Emulate What Works
 
 
  • Trading Systems
  • /
  • Trading Made Simple(r)
  • Reply to Thread
    • 1 254255Page 256257258 416
    • 1 Page 256 416
1 trader viewing now
  • More
Top of Page
  • Facebook
  • Twitter
About FF
  • Mission
  • Products
  • User Guide
  • Media Kit
  • Blog
  • Contact
FF Products
  • Forums
  • Trades
  • Calendar
  • News
  • Market
  • Brokers
  • Trade Explorer
FF Website
  • Homepage
  • Search
  • Members
  • Report a Bug
Follow FF
  • Facebook
  • Twitter

FF Sister Sites:

  • Metals Mine
  • Energy EXCH
  • Crypto Craft

Forex Factory® is a brand of Fair Economy, Inc.

Terms of Service / ©2022