What about this one. Regarding to the TMS rules this would be a valid entry for H1? {image}
Ignored
Because not everyone uses the same entry criteria, it would be helpful in future enquiries if you listed the criteria that you use and which were met and not met.
What about this one. Regarding to the TMS rules this would be a valid entry for H1? {image} And how would you determine if the pair is trending or not? From the below charts to me this all looks freaking hard to read and contradictory. Actually when ever i switch through different time frames i start getting confused and have no idea how to adapt with my trade plan on the executional time frame (H1 in this case) where i also want to set SL/TP targets on. This is just one thing nobody ever could tell me in easy words and if you read 10 articles about...
Ignored
Here is a VERY simple approach.
Look at the HA bars in comparison to EMA5.
If they are below EMA5 and they are tending to make LH and LL on nearly every bar and there is some space between the tops of the bodies and the EMA5, and there is unmistakably a downward angle and not running sideways, then you definitely have a down trend. You need at last 3 bars. As the trend progresses, there will be 1 -6 retracement bars form that travel up toward the EMA5, and might even get 1 or 2 that go above EMA5. If they all stay below EMA5, then it is HIGHLY likely that it is merely a rally, so be looking for a continuation entry as price returns down.
And how would you determine if the pair is trending or not?
Ignored
It can be rather confusing because different people use different methods to determine trend, with different results.
I've tried drawing trendlines and using different combinations of MAs among other things. What eventually worked for me was when I called up a fresh chart, the green one on mt4, with nothing other than bars/sticks on it, and looked for higher-highs and higher-lows or lower-lows and lower-highs. We are all familiar with that 1-2-3 pattern (I like to call it an inverted thunderbolt).
So if you find a consecutive HH-HL-HH, you have an uptrend. LL-LH-LL for downtrend. From the GBPUSD charts you posted, I see LL-LH-LL on all of them.
Compare that to EURUSD, which is currently ranging. On D1, I see LH-HL-LH. On H4, LL-LH-HL. And on H1, HL-HH-LL, completing a double-top M pattern.
And how would you determine if the pair is trending or not? From the below charts to me this all looks freaking hard to read and contradictory. Actually when ever i switch through different time frames i start getting confused and have no idea how to adapt with my trade plan on the executional time frame (H1 in this case) where i also want to set SL/TP targets on.
Ignored
If you take a screen captures of a pair at several timeframes that have nothing to show what the timeframe is or price scale, then look at each screen capture independently (or give them to someone else to evaluate), can you determine what the timeframe is for each one?
Now try to mark where the trends are. I guarantee that you will NOT have every chart marked with all uptrends or all down trends. But that is contrary to what you probably have read, because if you look at D1 (or H4) and determine the trend there, THAT is the trend, right? So, if you determine the "big" timeframe is in a downtrend, then that must mean that EVERY timeframe under it is in a down trend. Uhhh, no.There is a downtrend for THAT SPECIFIC TIMEFRAME ONLY! If a single "big" timeframe sets the trend for all time frames below it, then how can a trend ever get reversed? The "big" timeframe could NEVER be reversed because every timeframe below it is in the same downtrend. So if in a downtrend, the only thing that could happen is to have rallies. But that is ALL they can be--rallies, not REVERSALS, because remember, you learned that the "big" time frame that is in a downtrend sets the trend direction for all of the timeframes below it. The "big" downtrend can only be reversed by EVERY timeframe below it going into an uptrend! If the "big" timeframe were the absolute direction master, then the lower timeframes could NEVER go from downtrends to uptrends. Now do you see the folly in the teaching of some "big" timeframe being some kind of direction master and how every timeframe must be evaluated for its own trend direction?
So now find a pair with H4 showing an obvious downtrend with a rally in it. Mark verticals at the start and end of the rally. Now switch to the M15 chart. Would you be surprised to find that H4 rally looks like a very nice UPTREND, including a pullback, on the M15? So, if you were a 1-timeframe watcher, as many people are, and you were looking at M15, would you be looking for buys or sells? Likewise, if you were looking only at H4, would you be looking for buys or sells during the same period?
{quote} It can be rather confusing because different people use different methods to determine trend, with different results. I've tried drawing trendlines and using different combinations of MAs among other things. What eventually worked for me was when I called up a fresh chart, the green one on mt4, with nothing other than bars/sticks on it, and looked for higher-highs and higher-lows or lower-lows and lower-highs. We are all familiar with that 1-2-3 pattern (I like to call it an inverted thunderbolt). So if you find a consecutive HH-HL-HH, you...
Ignored
The problem with hindsight finding 1-2-3 LL-LH-LL is that in many, many instances, that downtrend is about over. Sure, sometimes it continues to make 1-2-3-4-5, but in most cases, it does not, and waiting to see a clear 1-2-3 leaves little room for profit taking. The only reason you see things like 1-2-3-4-5-6-7 on a specific timeframe is because a VERY much larger timeframe is trending in that direction, so ALL the timeframes below that larger one are making retracements and continuations. And sometimes, a continuation fails, but not severely enough to reverse the trend of the larger timeframe, and then all of the timeframes below that failed one have to go through the cycles all over again, producing what appears to be extended trends.
{quote} Because not everyone uses the same entry criteria, it would be helpful in future enquiries if you listed the criteria that you use and which were met and not met.
Ignored
Yes Dave, that’s exactly my problem with this strategy as there is no true set and forget criteria based on objective settings you can find and repeat every new day.
I know i have to find my own criteria but still could not managed to do that.
Also the OP traded H4 which is to slow in my case but more like doesn’t fit my risk when setting SL even if it’s just under the setup bar. I don’t want to trade for pennies either because my time is to much of value to wait years to have grown my account by a $100 bucks and maybe also have collected some forward data to say if what I am doing is somehow correct.
The next problem I have is what to trade and between what times to trade.
I have the 8 major currency pairs opened at M15 side by side in the morning starting first look at them with London opening.
What I see then is most of the times slow moving currency pairs moving from nowhere no nowhere, sitting in a tight range. So I constantly jump through the charts for a a few hours and most likely end up taking a setup of low probability, jumping down to M5 or even M1 and try to predict a movement of a few pips without any clear defined rules either for entry nor for a possible exit because even on going down to M1 what I see most of the time is giving no even room for a few pips profit target.
Next problem is that I then want to trade with the trend but reality is most of these markets are going sideways until there is some news published.
So actually day trading currencies on M15 or even M5 seems to me almost impossible with consistency in such chaos and a strategy giving no clear rules for nearly nothing of what’s really important than waiting for an indicator signal. Not telling you how to achieve a constant routine, not telling you how to avoid over trading if you are on the lower time frames, not telling you if and how to look at different time frames if needed but in an objective way, not even giving you data from past results that you can st least say there is an positive expectancy after a 100 trades clearly taken for the same entry/exit criteria so you know if it’s you that sucks or the strategy that sucks.
The best part of it is that he named this „trading made simple“, for me this is not simple but even more worst is it has no single aspect of objective transparency.
Is there no single strategy on earth that simply works for day trading the markets without leaving you alone with a tons of subjective bullshit I could do differently each new day, where multiple time frame analyses and skipping through tons of different charts and all that crap is not needed to constantly grab a few pips by the end of the week?
{quote} It can be rather confusing because different people use different methods to determine trend, with different results.. Compare that to EURUSD, which is currently ranging. On D1, I see LH-HL-LH. On H4, LL-LH-HL. And on H1, HL-HH-LL, completing a double-top M pattern.
Ignored
But look at the EU W1. It clearly has been in a downtrend for a LONG time, making mostly Lh, LL. However, the last rally was a HH--an attempt to start a new uptrend. So, if it were indeed to be the start of an uptrend, then the pullback must make a HL. In addition, you expect the pullback will retrace around 50-60%, and get concerned when you see it reach 80%. But what actually happened was that the pullback went clearly beyond 100% retracement, breaking the prior L, showing that the attempt at going into an uptrend has failed, and the downtrend continues.
If you mark the W1 upswing with verticals and switch to D1, you see 1-2-3 with an extremely weak -2- of a single bar. Switch to H4, you see 1-2-3-4-5 and maybe even -6-7. By the time your reach M15, you have many opportunities for selling as well as buying.
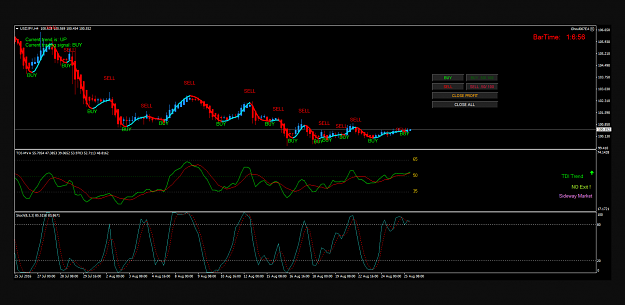
{quote} Tekkies you useless TDI alert indicator does not show TDI green line Prev Slope and Current Slope as in the TMS Monitor by arbinka. no need to guess the 12-2 and 4-6 clock face... too subjective visual view. Just read the value and make trading decision. a few good trades Big E 2AM H4 candle. {image}
Ignored
For a member that post TDI is not in the winning equation, you are surely addicted to the TDI indicator.
{quote} Yes Dave, that’s exactly my problem with this strategy as there is no true set and forget criteria based on objective settings you can find and repeat every new day. I know i have to find my own criteria but still could not managed to do that. Also the OP traded H4 which is to slow in my case but more like doesn’t fit my risk when setting SL even if it’s just under the setup bar. I don’t want to trade for pennies either because my time is to much of value to wait years to have grown my account by a $100 bucks and maybe also have collected...
Ignored
USD is THE most traded currency. Look for pairs that contain it, preferably the majors.
Developing a trading plan is not some simple overnight exercise.
You have already set 2 criteria that I know of: TDI green x red; HA bar closed on the trade side of the EMA5. I suspect, because you have it on your chart, that you use stochastics as well. In any case, write down your current setup, entry and trade management criteria and simply follow it like a robot. After at least 30 trades, evaluate the ones that came out negative. See if you can find anything in the way price looks leading up to the entry criteria on those trades that is noticeably different from the winning trades. If you see something, can you devise a filter for it? If you do not find anything, then you have nothing to change from what you are doing.
Also, if some of the losers went into profit for a while, determine how close it came to TP. If you made a single change, such as a small reduction in TP across the board to bring half of those types of losers into winners, will the additional pips gained offset the pips lost on all of the other winners due to that small reduction in TP?
{quote} For a member that post TDI is not in the winning equation, you are surely addicted to the TDI indicator.
Ignored
He has no choice, considering that it is REQUIRED for the TMS_V19 EA to run.
Really, wouldn't it be better if he would simply open a thread "Using EA TMS_V19 to Reap Riches"? Then all of the clutter and nonsense that he spews about the EA and his KAKs postings that are irrelevant to the TMS thread would be gone from here.
{quote} Tekkies You idiot. That message if from the TMS_V19 internal function operations. That is not a mistake and you still have not downloaded and install that TMS_V19 EA in your trading PC. Study the Manual learn what that message means. Smiley face means the EAs is still active running. Youi can have as many of the EA running in the same trading PC and same currency pair too. You just need to inpout different magic number for each of the chart you run and the same EA will manage the trades using the magic number. See what I mean, you know nothing...
Ignored
Will type it slowly so that you can understand:
Alert will / can / could display some other information after a time and the trader will never know that one of the expert's has suspended it self.
---- Let me help you a little bit. One Expert or xxx expert's on platform, the alert about suspension will scroll away / down / out of sight. Unless you can show where the Expert can still notify the user that one pair out all the pairs being traded is suspended after many hours. That is a mistake, because the left side is does not display / retain that information. ---- Have been where you are now with V_19. About four years ago, the thing is going to bite you Emmanuel.
{quote} If you take a screen captures of a pair at several timeframes that have nothing to show what the timeframe is or price scale, then look at each screen capture independently (or give them to someone else to evaluate), can you determine what the timeframe is for each one? Now try to mark where the trends are. I guarantee that you will NOT have every chart marked with all uptrends or all down trends. But that is contrary to what you probably have read, because if you look at D1 (or H4) and determine the trend there, THAT is the trend, right?...
{quote} For a member that post TDI is not in the winning equation, you are surely addicted to the TDI indicator.
Ignored
Tekkies spends too much on his TDI and Stochastics, now on his M15 & H1 V-lines gimmicks. Tekkies did not spend enough time on Post#647 to learn Price Action, Support & Resistance and Market Consolidation. Tekkies should spend more time on Money Management, Risk management for entries and exits. Tekkies should learn to reduce his large number of BE trades, and How to Let Profits Run. Tekkies will one day learn Post#2617 and he will realize that he can strip the TDI and Stochastics from his trading charts and he would then realize that taking trades would be a breeze and that the TDI is not in his WINNING EDGE equation.
Honesty is a very expensive gift. You wont find it in cheap people.WBuffett
{quote} Will type it slowly so that you can understand: Alert will / can / could display some other information after a time and the trader will never know that one of the expert's has suspended it self. ---- Let me help you a little bit. One Expert or xxx expert's on platform, the alert about suspension will scroll away / down / out of sight. Unless you can show where the Expert can still notify the user that one pair out all the pairs being traded is suspended after many hours. That is a mistake, because the left side is does not display / retain...
Ignored
Tekkies
No matter how slow you type on your keyboard you still have that problem of yours. Its inherent in your DNA.
Really? you tried seller9' TMS_V19 MTF fours years ago? I think you are lying again now.
I learned from your previous posts and uploads that your were using an TDI based EA by another member Ghoul and you got margin call and you blame member for that.
You could not fix that bug in that EA despite having that source code.
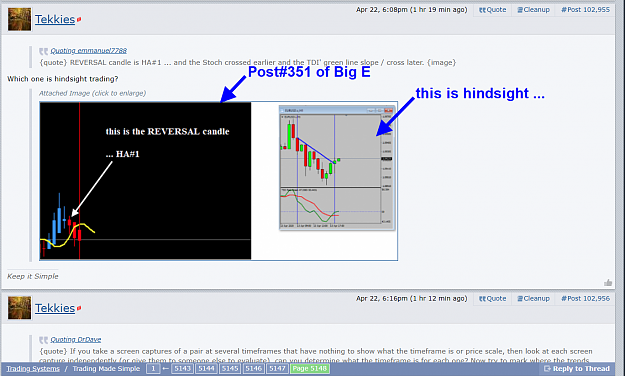
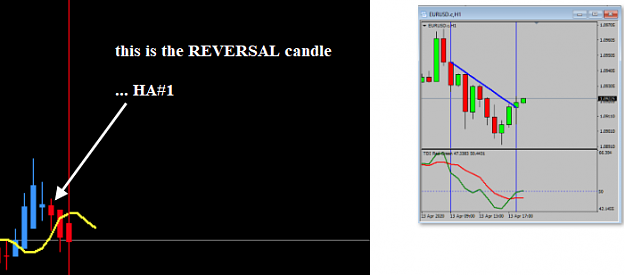
{quote} Left chart is by the OP , its in Page 22 of BigE full pdf Right chart is hindsight and has nothing to do with the OP's TMS 5-Method. {image}
Ignored
When you or BigE refer to a candle that is 3 candle's back (12 hours) it is not hindsight.
When Tekkies draw between two TDI crossover a trend-line (10 hours) it is hindsight.
You have no clue what is hindsight trading.
-----
Based on Post 283 : entries marked with vertical lines...
What on that chart of Tekkies is not part of TMS 5-Method?