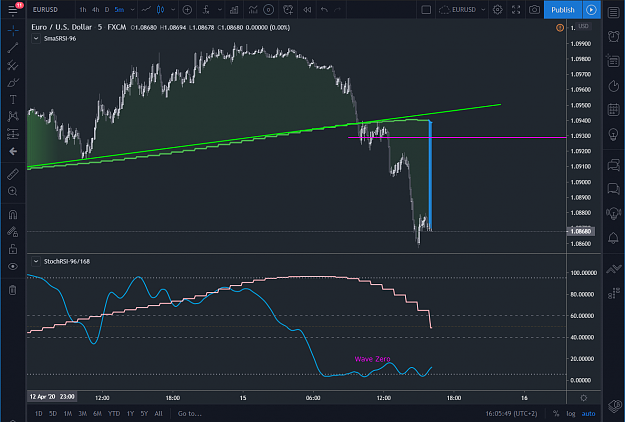
DislikedJust closed some more as we are now under SMA... Check your oxygen tubes we will be soon under the water...Ignored
5/6 candle swing low swing high Indicator 5 replies
Swing high / Swing low indictator+alert? 20 replies
Trading Swing by Swing 39 replies
Swing highs and swing lows 3 replies
swing high/swing low indicator and volume tic history 13 replies
Disliked{quote} Good morning; yes I closed all the longs, are you thinking this as a start of bearish signal (zero )?Ignored
DislikedIn my short experience, there has not been a 100% working strategy! But with proper management a 70% working strategy will pay you. This strategy has close to a 90% or more chance to succeed "if it is followed!" I salute you broketrader! I salute all who have been following! P.s the last signal occurred while I was asleep! Edited Added the chart I see this morning {image}Ignored
QuoteDislikedBut yes, I anticipated a bearish signal but the following hours proved that it was all fake, we got everything, cross of the trend line and SMA and finally also the signal but it only lasted one bar! And the price rebounded from there, and from there we got a fresh new long signal and more than that, the price traveled back above our previous trend line which forced me to close my anticipated shorts and enter a new long to be in sync again with the trend.
Bororo was asking previously if we were going to have our first failure, well this was it...
Disliked{quote} Good luck with your trade, I don't know which system your chart shows but certainly not the one we trade here so please avoid posting charts not in relation to this, it's in post #1.Ignored
Disliked{quote} Hello Broketrader, In my opinion it isn't a failure if you draw your trendline with the candle's wick instead of the closing price. In that case you will see that the closing price at your signal was still a little bit over the trendline. And more surprisingly, as seen in my screenshot, you will also see the price has rebounded at almost the same time on a longer red trendline that I still have on my chart with daily price peaked in the 9th march and 27th march. Nevertheless I did not took into account these trendlines and was convinced...Ignored
Dislikedi know this question has been asked multiple times along the thread but I need a solution to why the SmaSRSI96 only appears on my 5m chart. I have tried changing the script as guided from broketrader. I have also tried multiple versions. there is confusion can we get to the bottom of this for the sake of myself and others?Ignored
DislikedI'm out of the trade for now. Since I came to the party late, I did put in a small order on the 9th, which got hit with the test that happened today. I also have a buy stop at 1.09711 but I doubt we will see that this time around. I'm planning on followning the strategy and waiting for the next clear signal before placing any orders. I use MT4 but am going to take some time to implement your signals on TradingView this week just to diversify my knowledge of platforms and also keep my nose in the charts. DanIgnored
Disliked{quote} I would like to help, I'm trying to figure out what could be the issue but I don't see, there is nothing particular about the H1 time frame in the script, it just uses different periods for calculation in M5 and H1. As others here, including myself don't see the issue on our configurations, it must be something local on your side or at your broker. Maybe you could try to make a duplicate fresh installation of MT4 in a different folder with all parameters default and see if the indicator works there.Ignored
DislikedFor anyone struggling to get the Indicators to work on MT4 I have attached a zip with: - The SMA & SRSI indicators that worked for me & match exactly the same as tradingview Parameters - A profile of two EURUSD charts, 1H & 5M - A M5 Template ready to go & a 1h template. This should work so hope it helps. Edit*** Courtesy of Jagg {file}Ignored