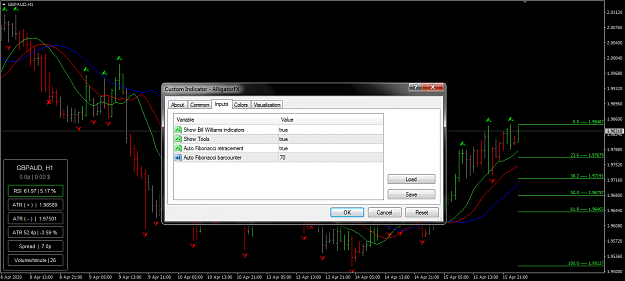
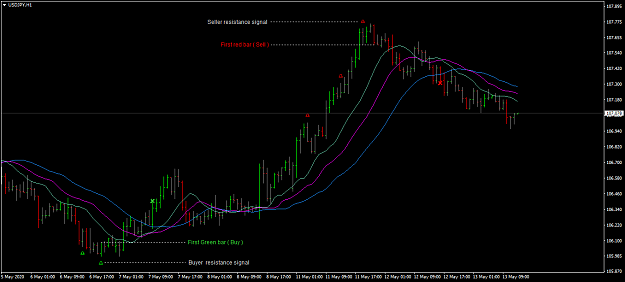
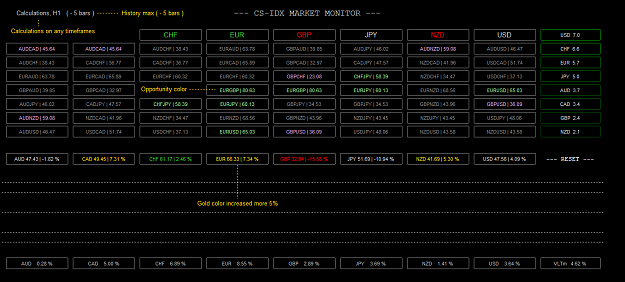
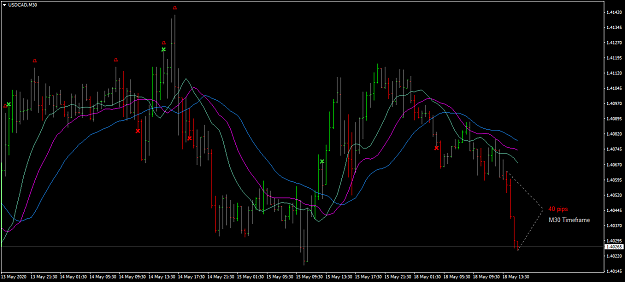
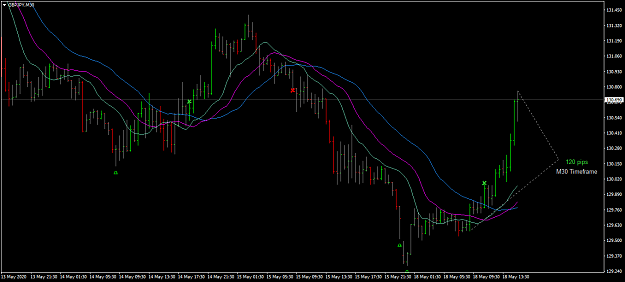
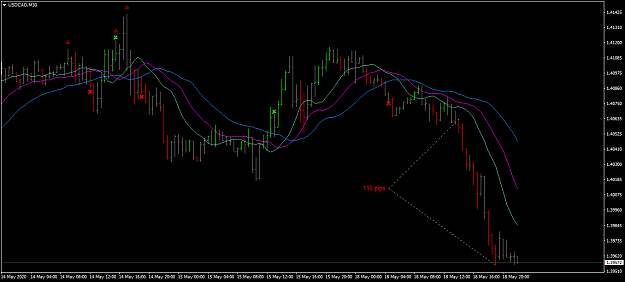
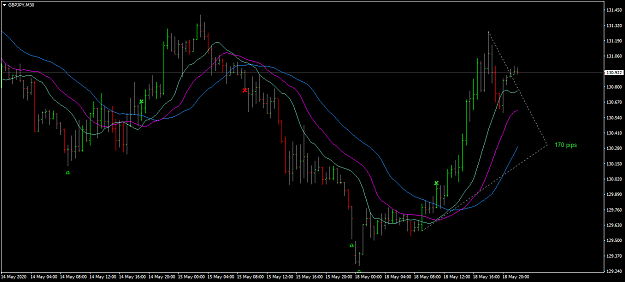
DislikedThank you Ac3w for your indicator I have a question On the following graph you see that GBP is crossing up CAD {image} but if you look at the reaction of the price it seems there is a little problem{image}
Ignored
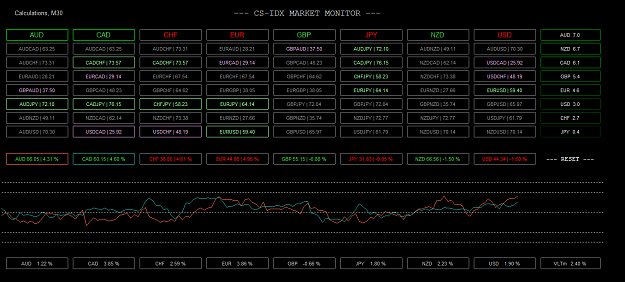
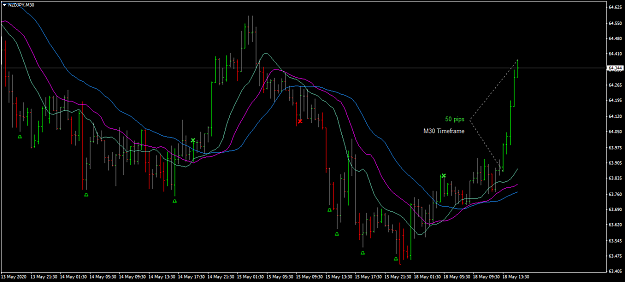
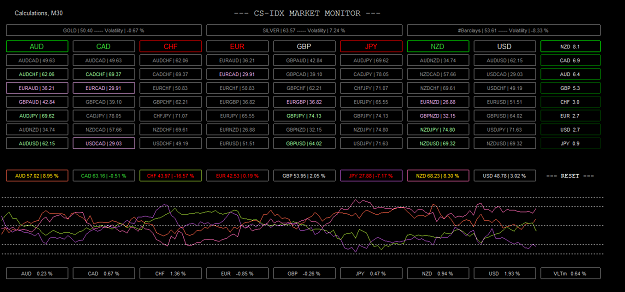
The graph works on daily calculations, if you want to look the same in looking at the graph, look on daily chart ( D1 ) after the market is open until tomorrow, and if you want to analyze on a smaller timeframes just look at the value.
2