Hi all, for a long time i don't write such an extensive post.
In fact, this might well be one of the most extensive posts i've ever wrote.
Hope, that 5% would be helpful to someone or any.
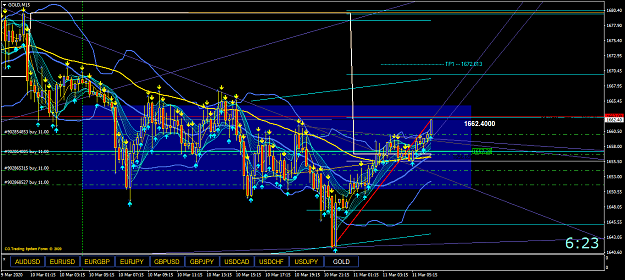
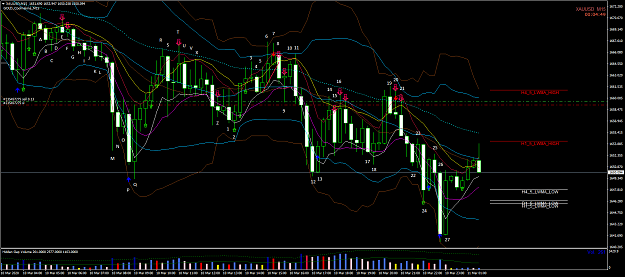
Day action on gold viewed from M15 only.(straight, the hard way )
)
Introduction:
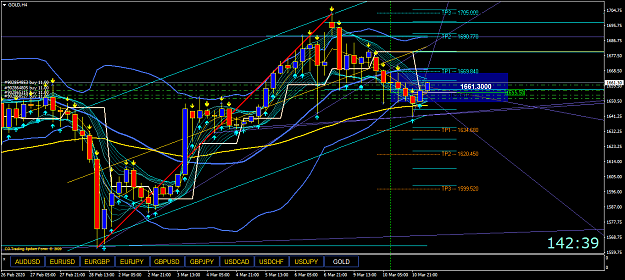
Price previously made a dive and created a range somewhere between 1685 and 1660.
Reading:
A - Price made a higher than previous, rejected midBB, and closed as a down bar, middle body of previous, volume higher than previous. Short sign.
B - Action of this bar validates previous statement, however volume was lower than previous 2 bars, no down strength. Long sign.
C - Is the result of B, up bar, but volume is also lower than previous 2 bars, no up strength. Short Sign.
D - Tests the highs of A, refusing to close above midBB, volume increased at resistance, Short sign.
E - Tests the highs of A, makes a higher high, rejects midBB, and close as a down bar, low body of previous, Short sign, but volume is lower than previous 2.
F - Up bar, narrow body, volume lower than previous 2, can be considered as "No Demand". Short sign - Entry could be taken.
G - Bar breaks the low of previous "no demand", with increased volume, supply coming in. bar crossed and closed bellow midBB and Malo5 & Malo10. Short Sign
H - Up bar, narrow body, volume lower than previous 2, "No demand". Price rejects midBB. Short Sign.
I - Is the result of H, price breaks low of previous, with increased volume, supply coming in. Short Sign.
J - Prices tests the highs, pierces Mahi5 and midBB and closes bellow, big top wick, supply. Short Sign.
K - Price breaks the low of previous, with increased volume. Short Sign.
L - Pin bar, increase volume, testing midBB and Mahi5, Short Sign.
M - With all those efforts behind, M is the result. Momentum bar. Big low wick. But it's volume is abnormal, smart money tends to buy on down bars with high volume. Long sign.
N - Fails to make a lower low. Volume decreases a bit. No more selling? Long sign.
O - Price makes a lower low, but closes as an up bar, closing up body of previous, increasing volume. Long Sign.
P - Price us marked/pushed down, new low on less volume, MLV? Long sign.
Q - Price makes a lower low, but closes as an up bar, closing up body of previous, high volume. 2 bar reversal at extreme area. Long sign.
R - Price is back testing Ema50. with volume lower than previous 2. Short Sign.
S - Is the reversal candle of previous test. higher volume, big low wick. Long Sign.
T - Price is back testing Ema50, with higher volume, big top wick, rejecting Ema50. short Sign.
U - Is the reversal candle of previous test, volume lower than previous 2. Long sign.
V - Up bar, narrow body, closing off the highs is kind of an up-thrust. Volume lower than previous 2. No up Strength. Short Sign.
X - Price testing the high, making a high, closing as a down bar with increased volume, Short Sign.
Z - Down bar, narrow body, with volume lower than previous 2 is a supply test.
1 - Price rejects midBB, big top wick, makes a higher than previous but close as down bar. Short Sign.
2 - Price make a lower low, but closes a an up bar, volume higher than previous, Long sign.
3 - Price is back on Ema50, rejecting it, with increasing volume, big top wick. Short sign.
4 - Reversal candle, however volume is lower than previous 2. Long sign.
5 - Prices test the highs, Ema50 and Mahi5, big top wick, volume lower than previous 2. short sign.
6 - Prices is pushed up, extreme. Price pierces but refuses to close above topBB. Big top wick. Volume very high. Short Sign.
7 - Price retests the high. Fails to make a new high. volume descrease. No more buying? Close bellow topBB. BB Flat. Extreme. Short Sign.
8 - Reversal candle, volume lower than previous 2. Long Sign.
9 - Price make a lower low but closes as an up bar. Big low wick. Increasing volume. Rejecting midBB. Long sign.
10 - Price goes up on low volume, volume is lower than previous 2. No buying interest. Short Sign.
11 - Price makes a higher high but close as a down bar. Volume increasing. Bearish engulfing bar, testing the highs, rejecting topBB, Mahi5 crossing Mahi10, price crossed Ema50, midBB, Malo5, Malo10 and closed bellow all of it. BIG SHORT!
12 - Price makes a extrema after momentum, lower low with volume lower than previous 2. Long sign
13 - Reversal candle, closing upper body of previous, increased volume. Long Sign.
14 - Price is back to test and reject midBB, big top wick, volume lower than previous 2. Short Sign.
15 - Reversal candle, increasing volume. short Sign.
16 - Price reverses to test the highs and rejects midBB, increased volume, Short Sign.
17 - Price fails to make a lower low. volume is lower than previous 2, No selling interest. Long sign.
18 - Price makes a lower low but closes as an up bar, increasing volume. Long sign.
19 - Price is retesting Ema50, price makes a higher high but closes as a down bar. short Sign.
20 - Price restests the highs, rejects Ema50. big top whick, volume lower than previous 2. Up-thrust. Short sign.
21 - Price tests highs, Mahi5, ema50, close down with increased volume, Short sign.
22 - price makes a lower low, volume lower than previous 2, no selling interest. Long sign.
23 - price a higher high, volume lower than previous 2, no buying interest. Short sign.
24 -Price is pushed down, increased volume, closing at extreme. Long Sign.
25 - Price makes a higher high but closes as a down bar. Short sign.
26 - price is pushed down, increased volume, closing at extreme. Long Sign.
End of trading day.
In fact, this might well be one of the most extensive posts i've ever wrote.
Hope, that 5% would be helpful to someone or any.
Day action on gold viewed from M15 only.(straight, the hard way
Introduction:
Price previously made a dive and created a range somewhere between 1685 and 1660.
Reading:
A - Price made a higher than previous, rejected midBB, and closed as a down bar, middle body of previous, volume higher than previous. Short sign.
B - Action of this bar validates previous statement, however volume was lower than previous 2 bars, no down strength. Long sign.
C - Is the result of B, up bar, but volume is also lower than previous 2 bars, no up strength. Short Sign.
D - Tests the highs of A, refusing to close above midBB, volume increased at resistance, Short sign.
E - Tests the highs of A, makes a higher high, rejects midBB, and close as a down bar, low body of previous, Short sign, but volume is lower than previous 2.
F - Up bar, narrow body, volume lower than previous 2, can be considered as "No Demand". Short sign - Entry could be taken.
G - Bar breaks the low of previous "no demand", with increased volume, supply coming in. bar crossed and closed bellow midBB and Malo5 & Malo10. Short Sign
H - Up bar, narrow body, volume lower than previous 2, "No demand". Price rejects midBB. Short Sign.
I - Is the result of H, price breaks low of previous, with increased volume, supply coming in. Short Sign.
J - Prices tests the highs, pierces Mahi5 and midBB and closes bellow, big top wick, supply. Short Sign.
K - Price breaks the low of previous, with increased volume. Short Sign.
L - Pin bar, increase volume, testing midBB and Mahi5, Short Sign.
M - With all those efforts behind, M is the result. Momentum bar. Big low wick. But it's volume is abnormal, smart money tends to buy on down bars with high volume. Long sign.
N - Fails to make a lower low. Volume decreases a bit. No more selling? Long sign.
O - Price makes a lower low, but closes as an up bar, closing up body of previous, increasing volume. Long Sign.
P - Price us marked/pushed down, new low on less volume, MLV? Long sign.
Q - Price makes a lower low, but closes as an up bar, closing up body of previous, high volume. 2 bar reversal at extreme area. Long sign.
R - Price is back testing Ema50. with volume lower than previous 2. Short Sign.
S - Is the reversal candle of previous test. higher volume, big low wick. Long Sign.
T - Price is back testing Ema50, with higher volume, big top wick, rejecting Ema50. short Sign.
U - Is the reversal candle of previous test, volume lower than previous 2. Long sign.
V - Up bar, narrow body, closing off the highs is kind of an up-thrust. Volume lower than previous 2. No up Strength. Short Sign.
X - Price testing the high, making a high, closing as a down bar with increased volume, Short Sign.
Z - Down bar, narrow body, with volume lower than previous 2 is a supply test.
1 - Price rejects midBB, big top wick, makes a higher than previous but close as down bar. Short Sign.
2 - Price make a lower low, but closes a an up bar, volume higher than previous, Long sign.
3 - Price is back on Ema50, rejecting it, with increasing volume, big top wick. Short sign.
4 - Reversal candle, however volume is lower than previous 2. Long sign.
5 - Prices test the highs, Ema50 and Mahi5, big top wick, volume lower than previous 2. short sign.
6 - Prices is pushed up, extreme. Price pierces but refuses to close above topBB. Big top wick. Volume very high. Short Sign.
7 - Price retests the high. Fails to make a new high. volume descrease. No more buying? Close bellow topBB. BB Flat. Extreme. Short Sign.
8 - Reversal candle, volume lower than previous 2. Long Sign.
9 - Price make a lower low but closes as an up bar. Big low wick. Increasing volume. Rejecting midBB. Long sign.
10 - Price goes up on low volume, volume is lower than previous 2. No buying interest. Short Sign.
11 - Price makes a higher high but close as a down bar. Volume increasing. Bearish engulfing bar, testing the highs, rejecting topBB, Mahi5 crossing Mahi10, price crossed Ema50, midBB, Malo5, Malo10 and closed bellow all of it. BIG SHORT!
12 - Price makes a extrema after momentum, lower low with volume lower than previous 2. Long sign
13 - Reversal candle, closing upper body of previous, increased volume. Long Sign.
14 - Price is back to test and reject midBB, big top wick, volume lower than previous 2. Short Sign.
15 - Reversal candle, increasing volume. short Sign.
16 - Price reverses to test the highs and rejects midBB, increased volume, Short Sign.
17 - Price fails to make a lower low. volume is lower than previous 2, No selling interest. Long sign.
18 - Price makes a lower low but closes as an up bar, increasing volume. Long sign.
19 - Price is retesting Ema50, price makes a higher high but closes as a down bar. short Sign.
20 - Price restests the highs, rejects Ema50. big top whick, volume lower than previous 2. Up-thrust. Short sign.
21 - Price tests highs, Mahi5, ema50, close down with increased volume, Short sign.
22 - price makes a lower low, volume lower than previous 2, no selling interest. Long sign.
23 - price a higher high, volume lower than previous 2, no buying interest. Short sign.
24 -Price is pushed down, increased volume, closing at extreme. Long Sign.
25 - Price makes a higher high but closes as a down bar. Short sign.
26 - price is pushed down, increased volume, closing at extreme. Long Sign.
End of trading day.
Attached Image (click to enlarge)
If you don't know how to earn money, don't loose it.
12