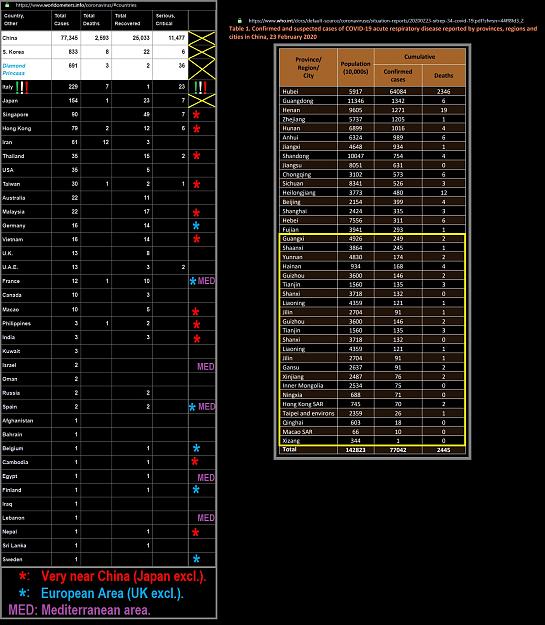
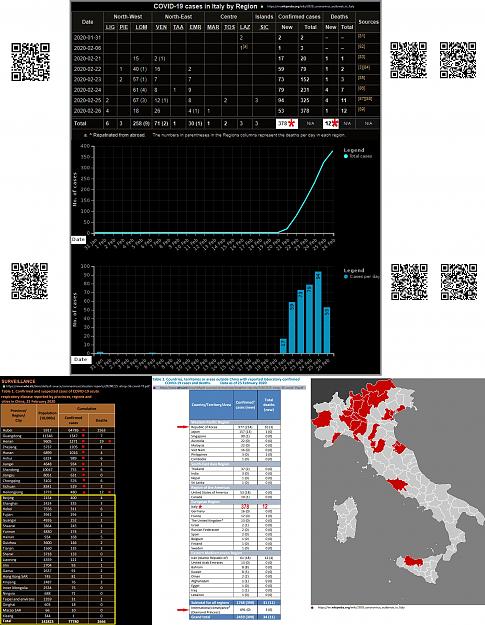
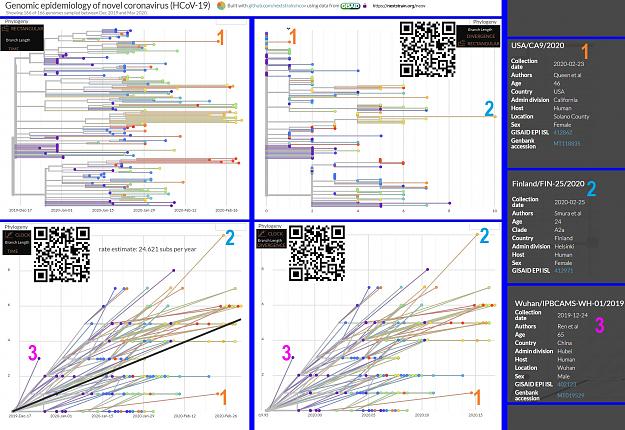
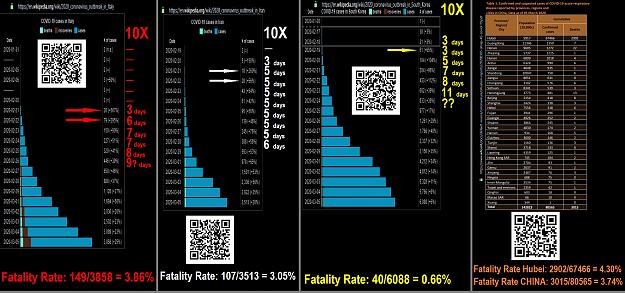
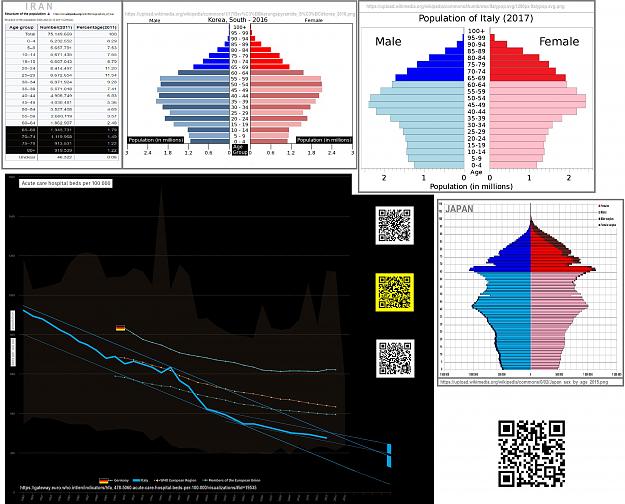
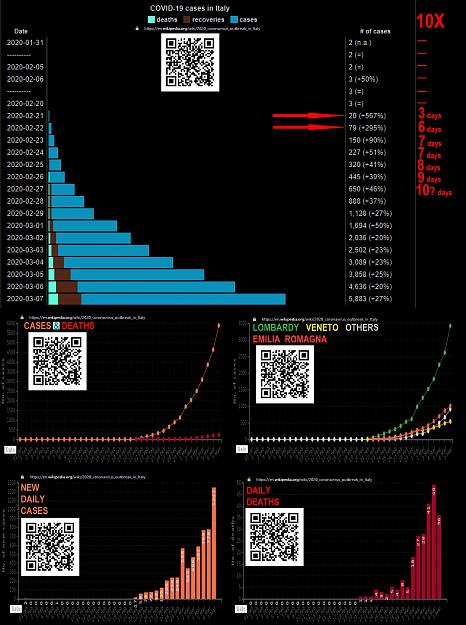
2019nCoV Coronavirus {Riboviria Nidovirales Coronaviridae Betacoronavirus COVID19; Hubei China}: data, papers, charts on Wuhan Outbreak - Italian abnormal outbreak.
![]() ►By..0000-0001-5086-7401 & lnkd.in/erZ48tm ◀
►By..0000-0001-5086-7401 & lnkd.in/erZ48tm ◀![]()
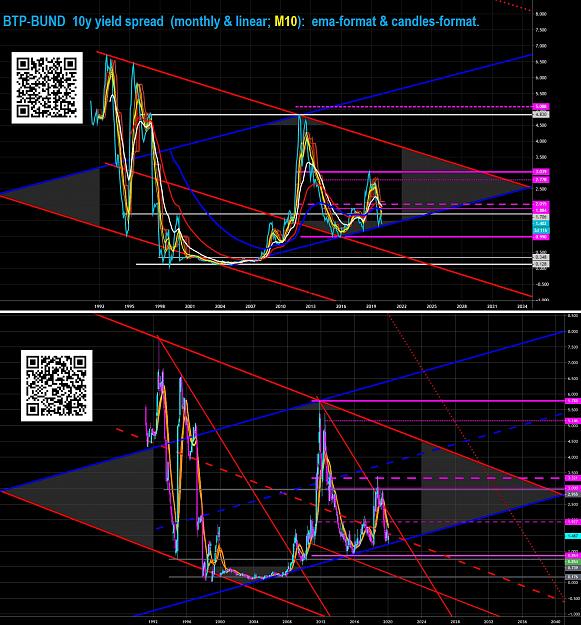
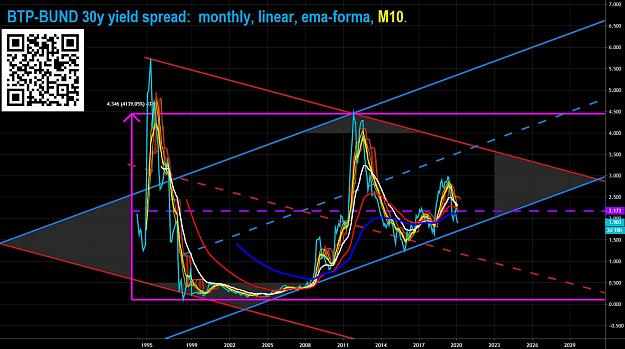
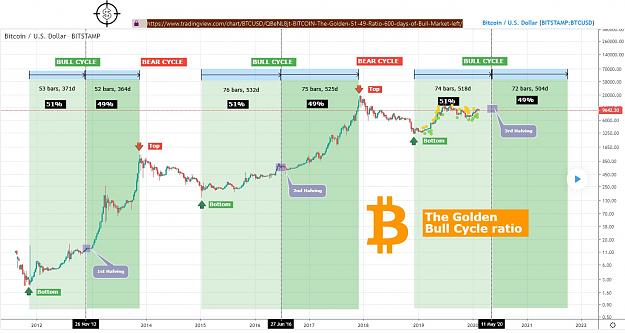
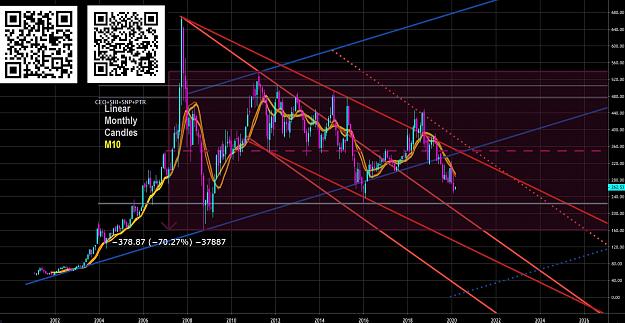
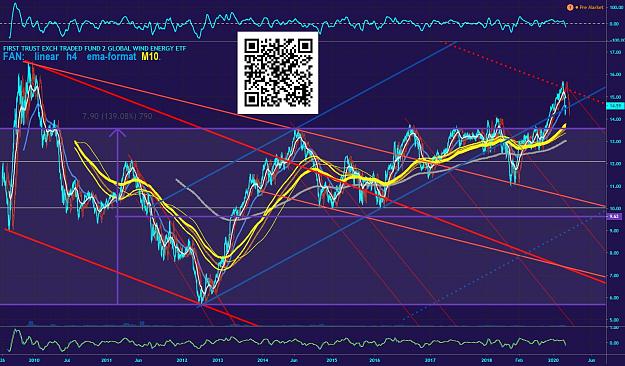
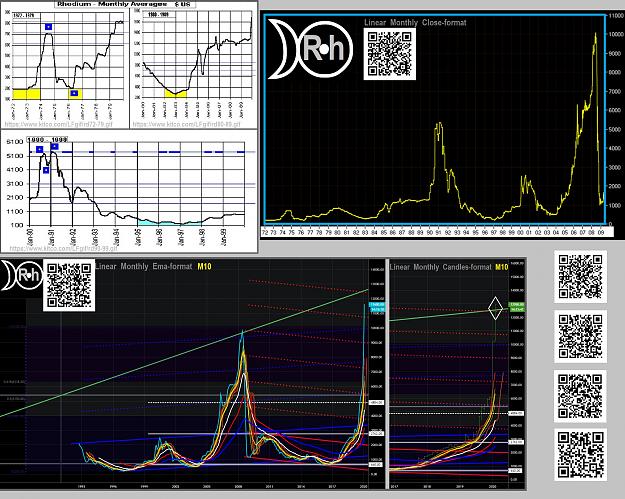
Data Slides Charts.
☒-{ Contact }-►►♡
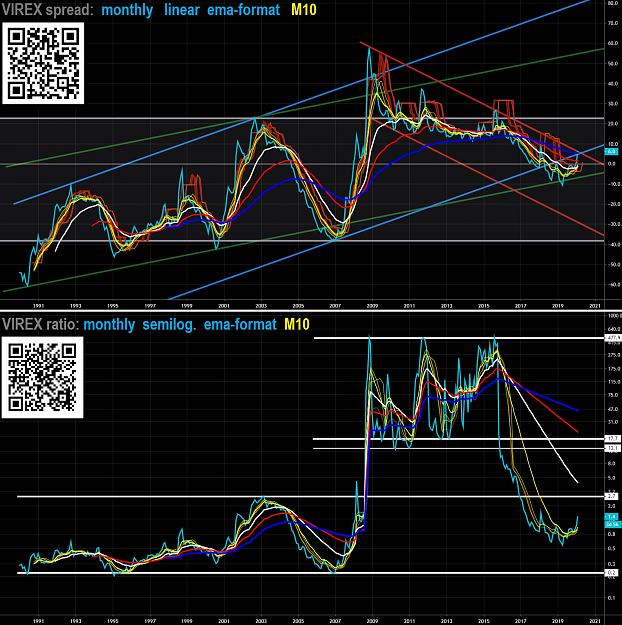
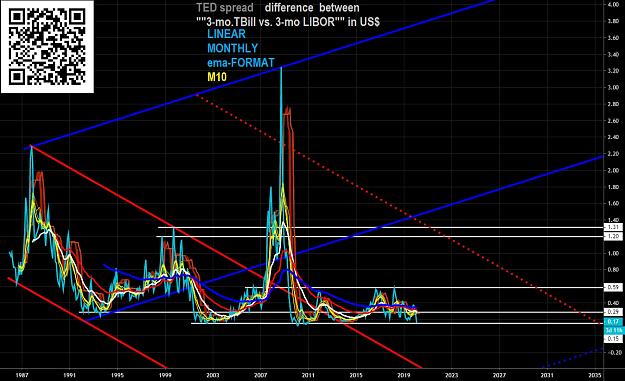
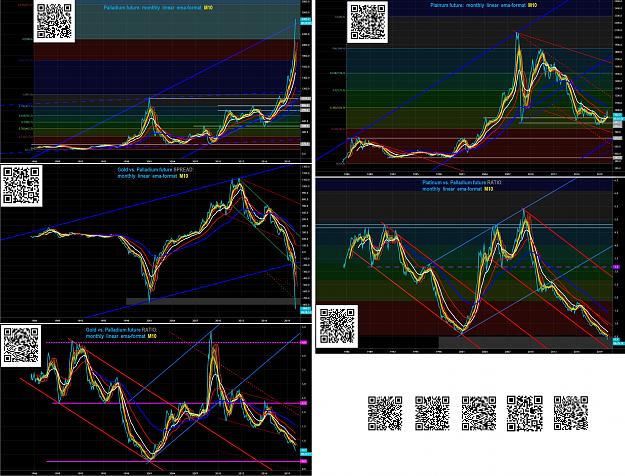
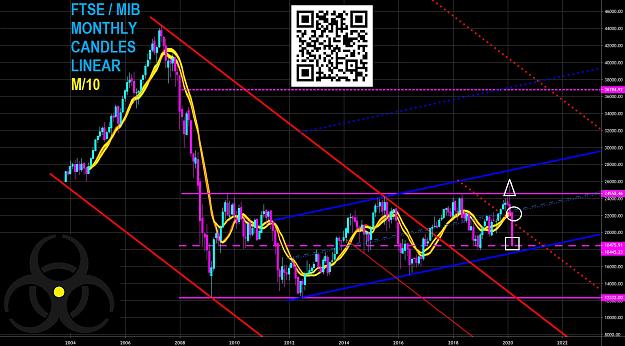
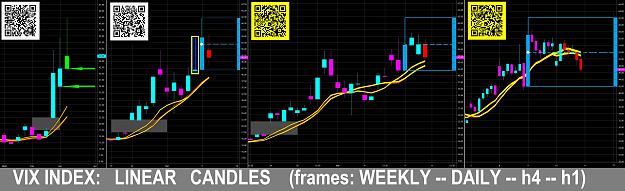
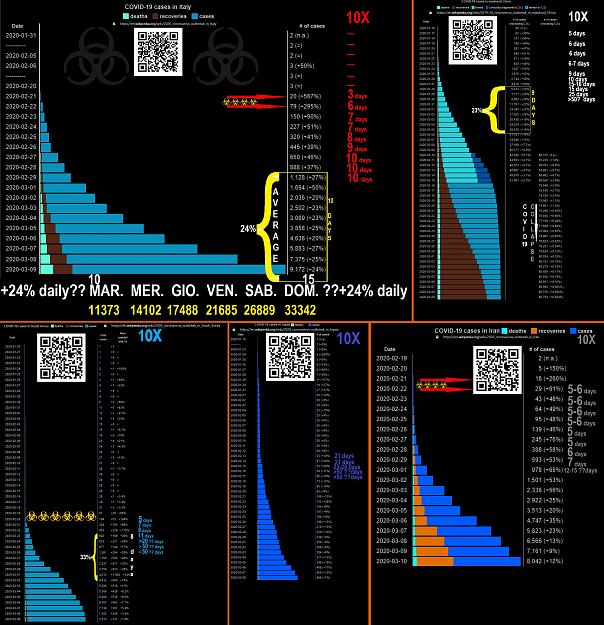
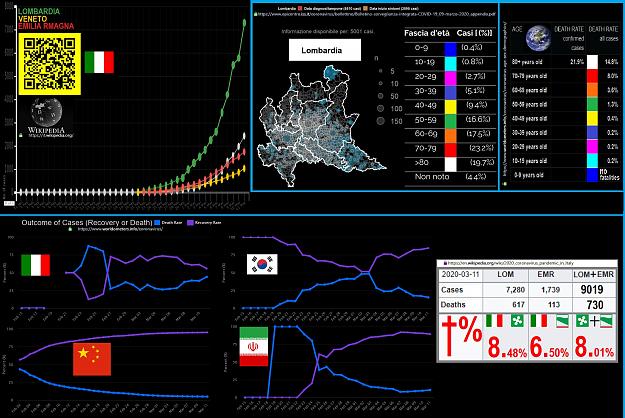
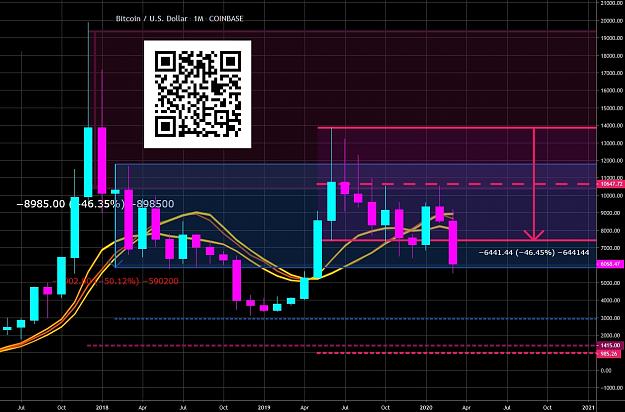
Attached Image (click to enlarge)