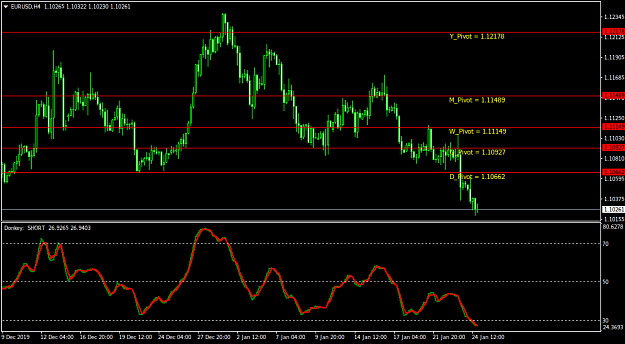
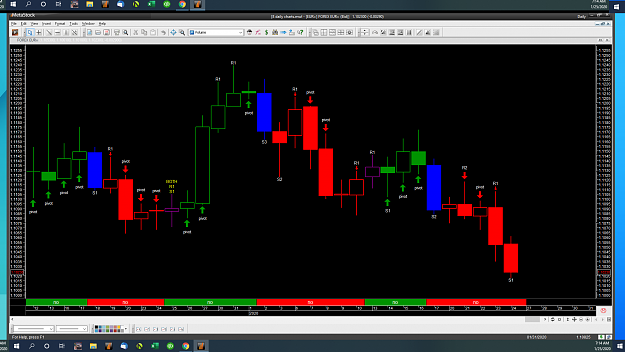
Daily chart showing trend changes. BLue candles indicate declining and purple candles indicate advancing trend. Arrows based on pivots going against trend.
Blue candle is created when low is lower than the last 2 days. Purple candle is created when high is higher than the last two days.
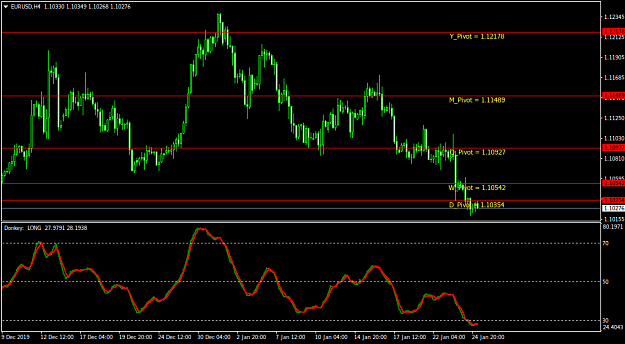
Blue candle is created when low is lower than the last 2 days. Purple candle is created when high is higher than the last two days.
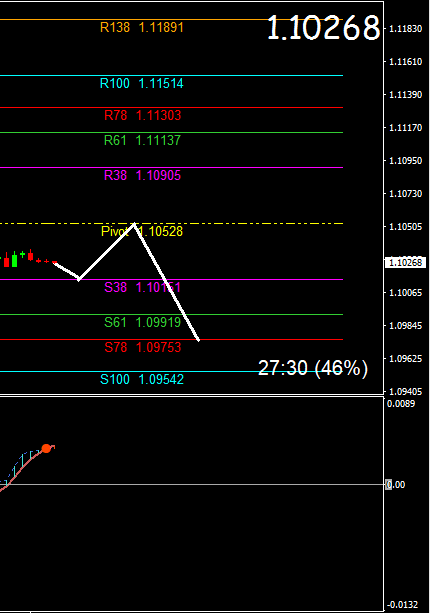
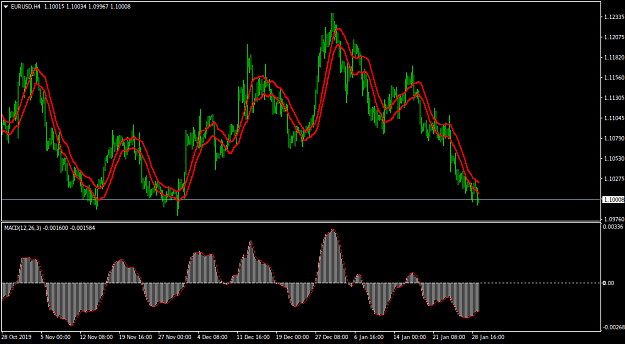
Attached Image (click to enlarge)
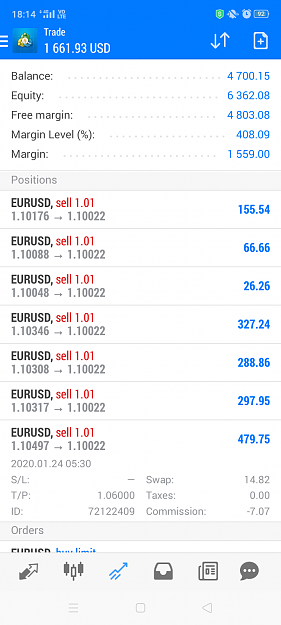
Managing your lot size is the key
1