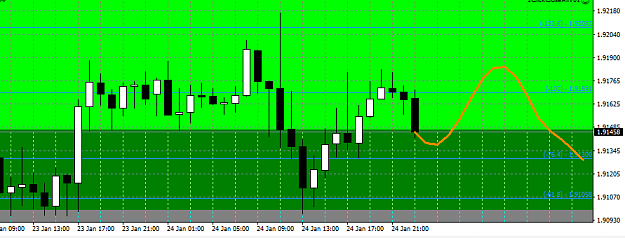
Disliked{quote} A little bit off-topic ;-) I use a Fourier Indicator to analyze the frequency of the "signal". Especially in a sideways market, when to expect highs and lows. The amplitude is not reliable, but the frequency and anticipating the future signal is sometimes scary acurate. You'll have to find the right timeframe though. Compared with a linear regression line, it is really astonishing. I did not find a strategy yet, but I use it to get a feeling for a pair... Linear regression blue, fourier "forecast" orange for GBPAUD on H1: {image}Ignored
I get it... you are applying the fourier to the "wave" that price has formed on the chart to determine the stronger frequencies. Then that is being applied back to the "regular" chart and thus u can calculate a possible trajectory for price. AWESOME!!
Once you determine the stronger frequencies you can use those in a moving average... So you could essentially have not only that fourier wave (orange line) but also a Moving average with the stronger frequency and then where both the MA and Fourier to agree at the target level.
Never thought of using the FFT in this fashion,, I was looking at price not the "frequencies" or periods that are right there in the WAVE of the price action....
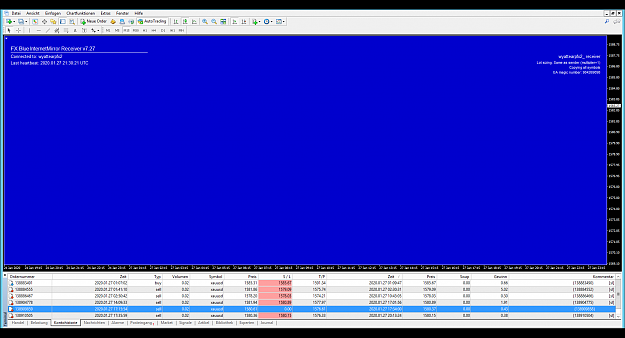
BTW I eyeballed your GBPAUD analysis and entered a long when price fell to 1.9100 with a stoploss of about 6 pips. I am risking about 0.6%.
My target is set to about about 1.9212 (112 pips). Right now I am about 60 pips intro profit, I have now set my stop at about 15 pips (1.5% gain).
Lets see if it will reach 112 pips or 11.2%.
Our AWESOME IMAGINATION is the true holy grail!
1