An FLD is a line that is plotted on the same scale as the price and is in fact the price itself displaced to the right (into the future) by (approximately) half the wavelength of the cycle for which the FLD is plotted. There are three FLD's that can be plotted for each cycle:
An FLD based on the median price.
An FLD based on the high price.
An FLD based on the low price.
Why do we say that the FLD is displaced by approximately half the wavelength? That is because the FLD is displaced by a slightly different amount depending upon its use.
How the FLD is used
When an FLD is based on the median price, it is used to confirm the troughs and peaks of cycles (that is why the FLD is described as a tool). For this purpose the FLD is displaced by half the wavelength of the price (rounded down, or truncated to a whole number) plus one bar, which postpones the confirmation provided by this tool by an amount between a half and one full bar.
When an FLD is based on the low or high price, it is used to as an immediate action signal for trading. For this purpose the FLD is displaced by half the wavelength of the price (rounded down, or truncated to a whole number), which does not postpone the signal at all, and provides a slightly quicker response from the FLD.
The FLD in fact provides three pieces of information:
The confirmation of a peak or a trough of the cycle:
When price crosses above the FLD from below, this is a confirmation that a trough of the cycle to which the FLD applies has occurred.
When price crosses below the FLD from above, this is a confirmation that a peak of the cycle to which the FLD applies has occurred.
A projection to the next trough or peak of the cycle:
When price crosses above the FLD from below, a projection is created which is an equal distance (in terms of price) upwards from the crossing point as the distance from the low price at the (now confirmed) trough of the cycle to the crossing point. The projection in terms of time tends to be less accurate, although it is used as rough guide.
When price crosses below the FLD from above, a projection is created which is an equal distance (in terms of price) downwards from the crossing point as the distance from the high price at the (now confirmed) peak of the cycle to the crossing point. The projection in terms of time tends to be less accurate, although it is used as rough guide.
An indication of the future impetus provided by this cycle to price:
If an FLD is falling in the future, then the impetus provided by this cycle to price movement will be upwards.
If an FLD is rising in the future, then the impetus provided by this cycle to price movement will be downwards.
It follows from the above that:
when an FLD forms a peak, the cycle is likely to form a trough
when an FLD forms a trough, the cycle is likely to form a peak
Multiple FLD Patterns
A very important use of FLD's is in the observance of the patterns that multiple FLD's (the FLD's of many different cycles) form.
A very important use of FLD's is in the observance of the patterns that multiple FLD's (the FLD's of many different cycles) form.
There are in fact only three basic patterns:
A cascading pattern
A consolidation pattern
A combination pattern
Each pattern has some subtle variations which will be explained in the discussion of each type.
Gaps
In each of the patterns gaps might appear. Gaps are simply areas of the chart in which no FLD's are found, and they are visually apparent as gaps in the pattern! They are important features of a pattern because they affect the implication of the pattern profoundly.
Cascading Patterns
Cascading patterns are patterns formed by multiple FLD's which are running in parrallel, and which maintain a constant distance from each other. Cascading patterns tend to form during strong trend moves in the market.
Cascading patterns suggest the opportunity for a strong move in the opposite direction, and the longer they persist the more likely that move becomes.
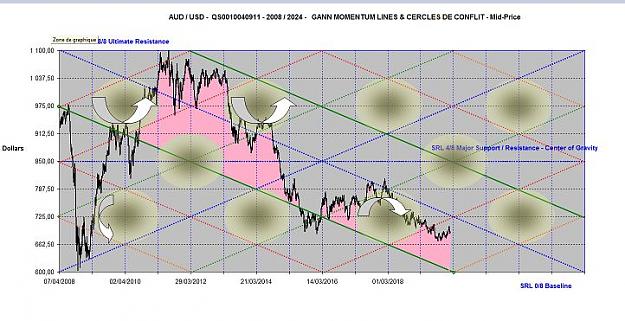
A long-term cascading pattern (with a consolidation pattern in the center):
Consolidation patterns are patterns formed by multiple FLD's which are moving against each others direction, within the same price range, and often reverse direction so that they traverse the same price range several times, overlapping one another. They tend to look like a tangled mess on the chart.
Consolidation patterns create Pause Zones. These are price zones in which price is likely to pause, or the development of a strong trend will hesitate.
Pause Zones can themselves be used to generate price projections (and are used by Sentient Trader). When price breaks out of a Pause Zone it is likely to travel as far beyond the Pause Zone as the distance from the most recent peak or trough to the center of the Pause Zone. Pause Zones are displayed in Sentient Trader as translucent blue shapes which are displayed whenever the FLD's are displayed on a chart (because they are of course the result of FLD patterns).
By far the most common pattern found on a chart is a combination pattern. This is very simply a combination of one or more cascading patterns with one or more consolidation patterns.
Combination patterns are described according to the cycles that form constituent patterns, such as:
A cascading pattern of the 5-day to 20-day cycles, and consolidation pattern of 40-day to 20-week cycles, and a cascading pattern of the 40-week and 18 month cycles.
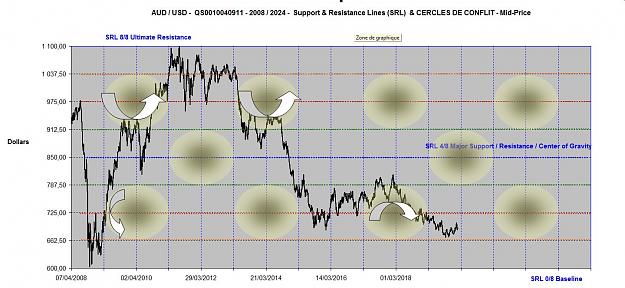
A combination pattern which includes a 40-day to 20-week consolidation pattern and a 40-day to 40-week cascading pattern:
The implication of multiple FLD patterns is of course of more interest than their identification. Sentient Trader calculates an FLD Pattern Projection for each cycle which is a projected price move implied by the multiple FLD pattern, within the context of each cycle. These FLD Pattern Projections can be displayed or hidden by using the FLD Pttn button in the toolbar. As many Pattern Projections as you like can be displayed on the chart.
Multiple FLD Pattern Projections are the implication of the FLD Patterns found on the chart. This is how they are calculated:
For each cycle Sentient Trader first calculates a projected path for price based upon the phasing analysis and other projections that have been generated (FLD, VTL, Triad, Mid-Channel & Channel projections).
Based on this projected price path Sentient Trader then works out what will happen as price interacts with the FLD pattern on the chart. It does this by stepping forward along the projected price path one bar at a time. Where the projected price crosses an FLD (Sentient Trader also considers VTL's in this process as a matter of interest, but for the sake of easier understanding we will discuss FLD's only), a projection is created (refer the section about FLD's to understand FLD projections).
A new price projection is generated as a result of this expected price crossing of an FLD, and the process continues: Sentient Trader steps forward from this point, along the new projected price path, until another FLD is encountered, in which case a new projection is generated, or until the projected price path carries price into a gap in the pattern, in which case the pattern projection terminates.
By following the logic of this process you will understand why cascading patterns tend to produce strong projections, because each FLD projects price to a position beyond the next FLD in the cascading pattern, which then in turn projects price beyond the next FLD in the pattern, and so on.
On the other hand the logic of this process also explains why consolidation patterns produce Pause Zones. Because of the nature of consolidation patterns, the FLD's tend to project price move in contrasting directions, resulting in a pause in the trend of price.
I have been reading your lasted files ref Gann that you shared at my request. Very impressive & informative reading. From all of my research over the last two years its is apparent the Hurst, Gann & Murrey are all on the same page of the book in reference to cycles. Gann is without question Imho the Master with few if any peers. Hurst came next, then Murrey after he claims he found his Murrey Math from reading the Tunnel Thru the Air book. Not sure how valid that statement is, but Murrey Math is without a doubt a by product of Gann's discoveries. Months after Murrey came on the scene I attempted a conversation with him & he would never take a call always referring calls to his assistants, so I never got his software.
Would you share how your trading the envelope cycles? I seems your trading the extreme levels, as I would do. Just interested in how you approach trading the envelopes. Thank you for all you share, your views & comments. Your truly have a firm grasp on cycle trading.
Hi Parisboy, I have been reading your lasted files ref Gann that you shared at my request. Very impressive & informative reading. From all of my research over the last two years its is apparent the Hurst, Gann & Murrey are all on the same page of the book in reference to cycles. Gann is without question Imho the Master with few if any peers. Hurst came next, then Murrey after he claims he found his Murrey Math from reading the Tunnel Thru the Air book. Not sure how valid that statement is, but Murrey Math is without a doubt a by product of Gann's...
Ignored
Ace
A partial answer because principles are simple even simplistic, but execution can be complex.
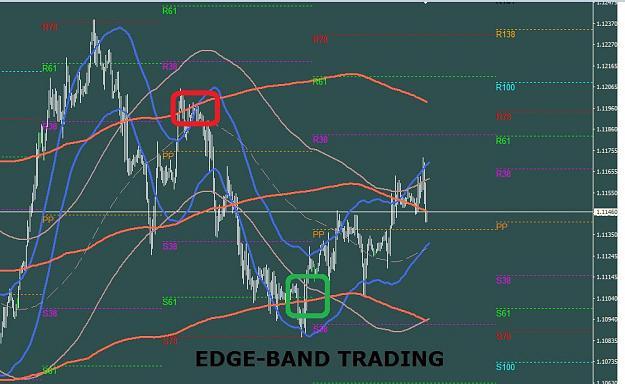
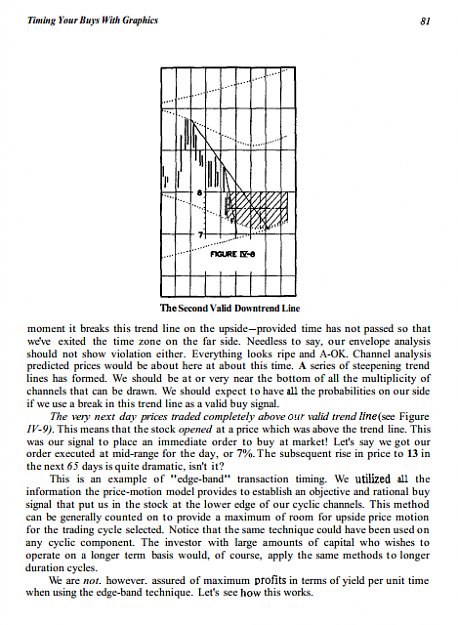
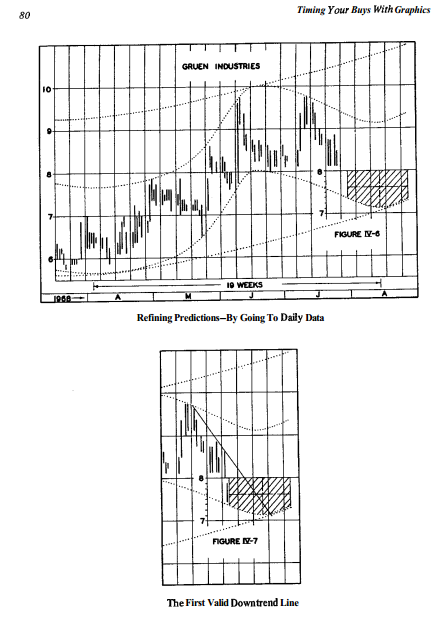
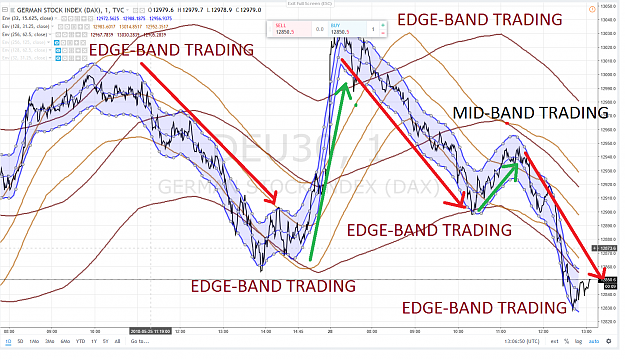
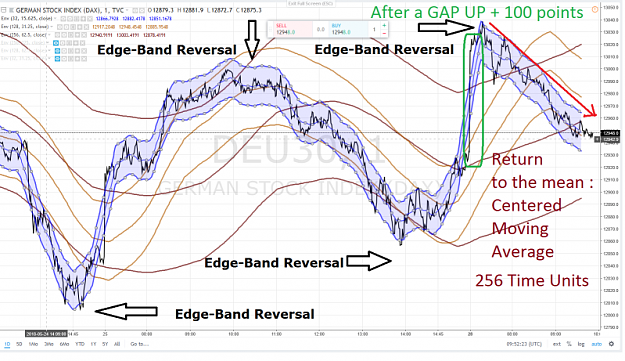
Hurst calls this concept Edge-Band Transaction Timing
Hi Parisboy, I have been reading your lasted files ref Gann that you shared at my request. Very impressive & informative reading. From all of my research over the last two years its is apparent the Hurst, Gann & Murrey are all on the same page of the book in reference to cycles. Gann is without question Imho the Master with few if any peers. Hurst came next, then Murrey after he claims he found his Murrey Math from reading the Tunnel Thru the Air book. Not sure how valid that statement is, but Murrey Math is without a doubt a by product of Gann's...
Ignored
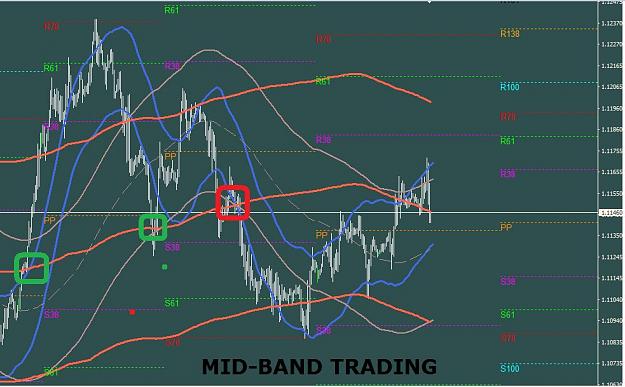
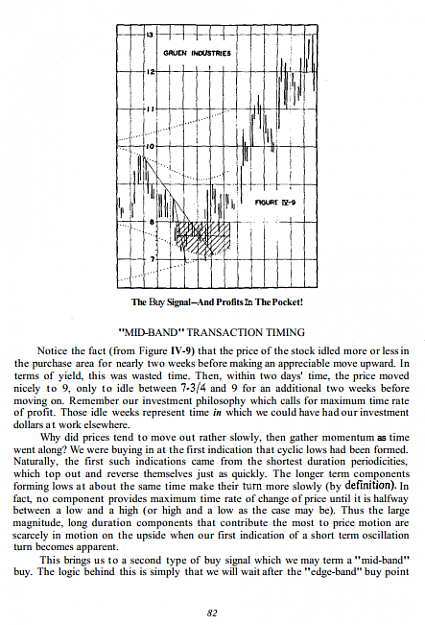
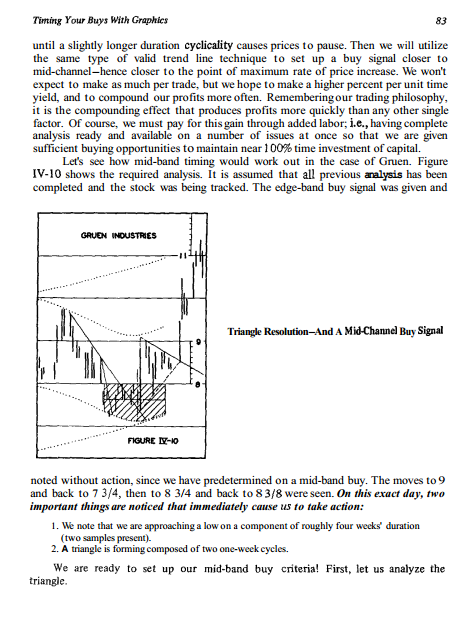
As soon as 1970 Hurst calls this concept Mid-Band Transaction Timing
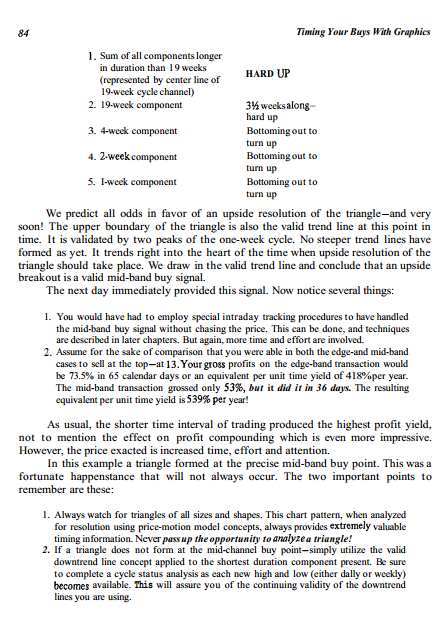
a) Roughly AB = CD = Amplitude of the Enveloppe 256 Time Unit (orange)
b) BC = 50 % retracement UP
c) BC is a Mid-Band Reversal
d) CD is an Edge-Band Reversal
How are you getting the bands to at the same time as the price? The charts that I have seen by others (MT4) have the bands behind the price by around 16 time units.
Hi Parisboy, How are you getting the bands to at the same time as the price? The charts that I have seen by others (MT4) have the bands behind the price by around 16 time units.
Ignored
BlackStack thank you for your interest
it is not my charts - ask the creator(s) Sohocool, OAPDave or others on this Thread or on Diamondminer thread.
My charts on TradingView use Centered Moving Averages displaced 16 data in the past
Anyway it is secondary to the Envelope methodology
Thank your for that very detailed reply. It is now coming together. It is simplistic in design yet it can be complicated in execution. MT 4 seems to have much limitations with scaling the chart to resemble what you are posting using Tradingview, but MT4 can be used. Unable to understand how I can get the Centered MA's on MT 4 using the envelope as there is no centered band with the envelopes. When using actual MA's (EMA'S) the centered band is there. What are your views on using MA's instead of the Envelops?
I know this is tech section question, but is anyone having trouble scrolling back in time on MT4 charts? I am unable to go back more that 6 weeks on any chart.
Is there a fix for this? Thank you to all that respond.
Hi Pariboy, Thank your for that very detailed reply. It is now coming together. It is simplistic in design yet it can be complicated in execution. MT 4 seems to have much limitations with scaling the chart to resemble what you are posting using Tradingview, but MT4 can be used. Unable to understand how I can get the Centered MA's on MT 4 using the envelope as there is no centered band with the envelopes. When using actual MA's (EMA'S) the centered band is there. What are your views on using MA's instead of the Envelops? I know this is tech...
Ignored
Sorry Ace I do not understand your question about Ma's
{quote} Sorry Ace I do not understand your question about Ma's could you elaborate , preferably with a chart
Ignored
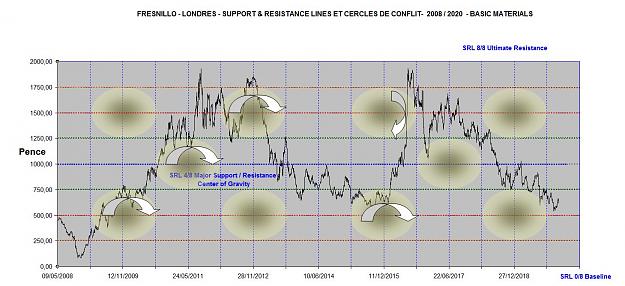
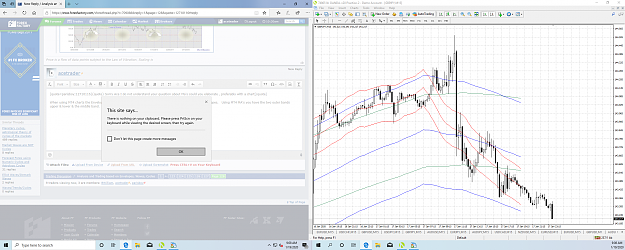
When using MT4 charts the Envelopes only have a lower & an upper band with no middle band as your envelopes. UAttachment vsing MT4 MA's you have the two outer bands upper & lower & the middle band. the attached chart depicts MA Envelope using 256, 128 & 32 shifted -16.
{file}{quote} When using MT4 charts the Envelopes only have a lower & an upper band with no middle band as your envelopes. U3532607sing MT4 MA's you have the two outer bands upper & lower & the middle band. the attached chart depicts MA Envelope using 256, 128 & 32 shifted -16.
Ignored
it seems ok to me
Ace the aim and utility of an Envelope is to "envelope" most of Price Action - that is the first rule
hence you do what you have to do to reach this target